
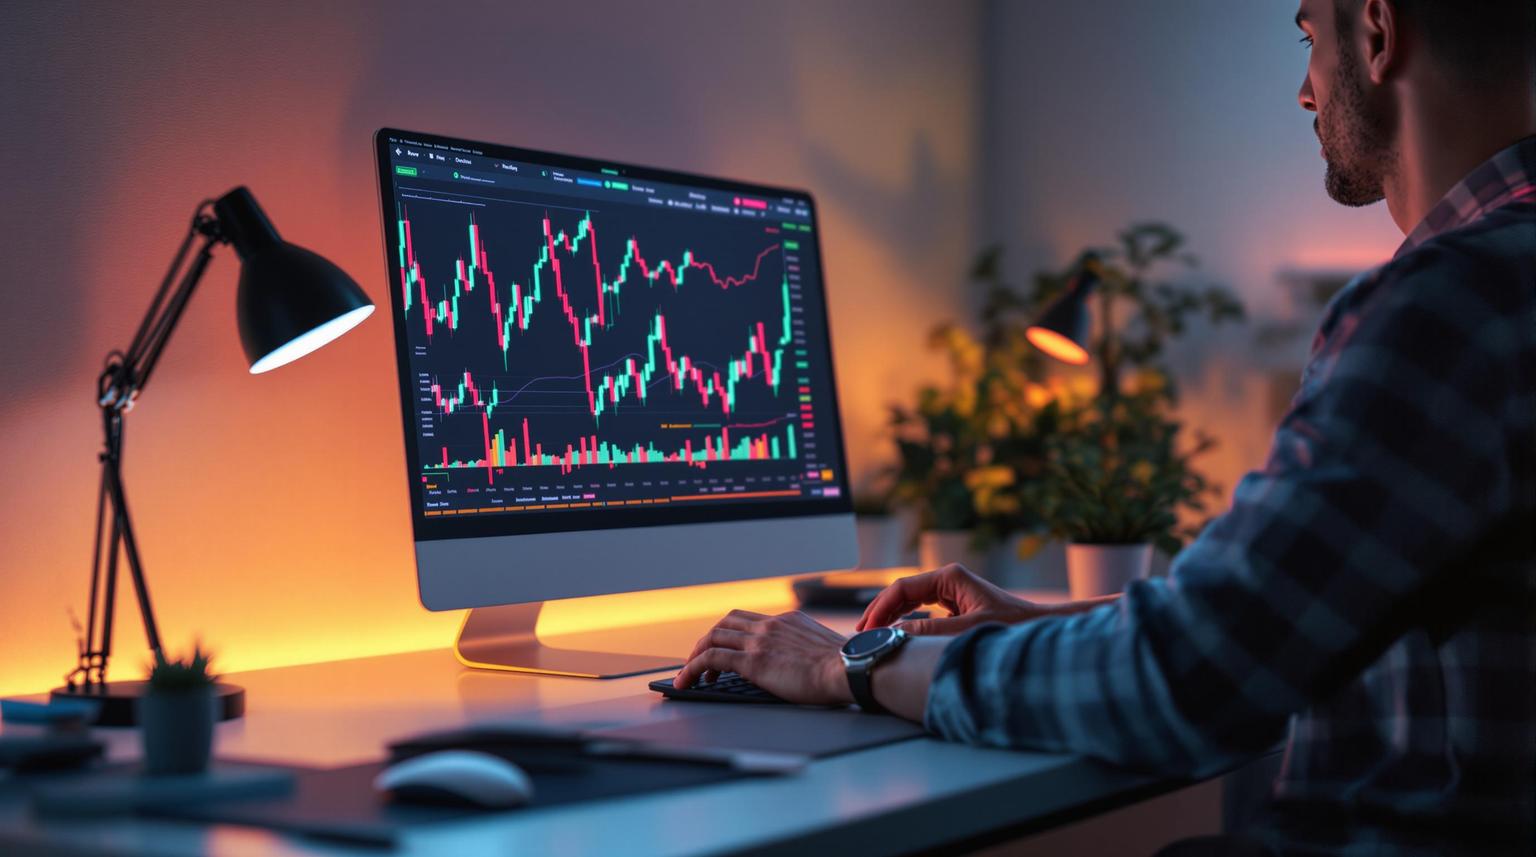
Candlestick charts are a powerful tool for traders to analyze price movements. Here's a quick breakdown to get started:
-
What is a Candlestick Chart?
- Displays price movement over a specific period.
- Each candlestick has a body (opening and closing prices) and wicks (highest and lowest prices).
-
Colors Matter:
- Green/White: Price increased.
- Red/Black: Price decreased.
-
Why Use Candlesticks?
- Spot trends, reversals, and market sentiment.
- Analyze strength using body size and wick length.
-
Key Patterns:
- Bullish (Price Up): Hammer, Morning Star, Bullish Engulfing.
- Bearish (Price Down): Shooting Star, Evening Star, Bearish Engulfing.
- Neutral (Indecision): Doji, Harami.
-
Confirmation is Key:
- Use indicators like RSI or moving averages.
- Look for high trading volume and price follow-through.
-
Practice First:
- Use demo accounts to learn without risk.
- Log trades and refine your strategy.
Candlestick charts are great for short-term analysis but work best when combined with other tools and strong risk management.
How to Read Candlestick Charts (with ZERO experience)
Main Candlestick Patterns
Candlestick patterns, built from the interaction of candle bodies and wicks, help traders anticipate price reversals or continuations.
Patterns That Indicate Price Increases
Certain patterns signal a potential upward shift in price, often following a downtrend. These patterns can highlight opportunities to enter long positions.
Bullish reversal patterns typically start at session lows and close near session highs, suggesting strong buying momentum.
- Hammer: A small body with a long lower wick, forming at the bottom of a downtrend.
- Piercing Pattern: Two candles, where the second opens lower but closes above the midpoint of the first.
- Bullish Engulfing: A large bullish candle that completely covers the previous bearish candle.
- Morning Star: A three-candle formation with a small-bodied candle between a bearish and a bullish candle.
- Three White Soldiers: Three consecutive bullish candles, each closing near its high.
Patterns That Signal Price Declines
These bearish patterns often point to a potential downturn in price.
- Evening Star: A three-candle reversal pattern beginning with a strong bullish candle, followed by a small-bodied candle, and ending with a bearish candle.
- Dark Cloud Cover: A two-candle setup where a bearish candle opens above the previous high and closes below its midpoint.
- Shooting Star: A single candle with a small body near the low and a long upper wick, appearing at the peak of an uptrend.
- Three Black Crows: Three consecutive bearish candles with long bodies and minimal wicks.
- Bearish Engulfing: A large bearish candle that completely engulfs the prior bullish candle.
Patterns Reflecting Indecision or Consolidation
Neutral patterns suggest market hesitation or a pause in the current trend.
- Doji: The opening and closing prices are nearly the same, showing a balance between buyers and sellers.
- Harami: A smaller candle fully contained within the range of the previous candle, hinting at a potential slowdown or shift in trend momentum.
Reading Patterns in Market Context
Market Trends and Mood
Candlestick patterns are more reliable when they align with the overall market trend and sentiment. Their strength grows when factors like trend direction, trading volume, and price follow-through all point in the same direction.
Take the bullish engulfing pattern as an example. It carries more weight if it appears after a prolonged downtrend, signaling a potential reversal in market direction. Similarly, hammer patterns become more credible when they are followed by upward price movement in the next trading sessions.
To evaluate patterns effectively, focus on confirming three key elements: strong trading volume, alignment with the broader trend, and follow-through price action. Adding clear confirmation steps can help you avoid falling for false signals.
Spotting False Signals
Even after identifying patterns that align with trend and volume, further validation is crucial. Here’s how to refine your approach:
- Use trend indicators like moving averages, MACD, or RSI to confirm the pattern.
- Look for volume spikes to ensure the move is genuine.
- Observe the behavior of subsequent candles to confirm price action.
Market conditions play a big role in how effective patterns are. For instance, high-volume markets generally produce more reliable signals than thinly traded ones with irregular activity. Before acting, wait for confirmation - watch for the market to behave as expected over several periods.
To minimize the risk of false signals:
- Keep an eye on volume levels during pattern formation.
- Rely on trend indicators, such as moving averages, for additional confirmation.
- Set strategic stop-loss orders based on the structure of the pattern.
- Wait for clear follow-through before entering a position.
Even the best-formed patterns can fail. The key is to follow essential risk management tips and wait for confirmation through subsequent price action and supporting technical indicators.
Practice with Demo Trading
Once you've learned candlestick patterns and how to filter out false signals, it's time to solidify those skills in a risk-free demo environment.
Demo Trading Steps
For Traders' virtual capital accounts offer a great way to practice recognizing patterns without risking real money.
Start with a smaller virtual account, like the $6,000 plan, to focus on identifying common patterns such as doji, hammer, and engulfing candles. Pay attention to how these patterns behave across different market conditions and timeframes.
Keep a detailed journal for every trade. Log the pattern, market context, outcome, trade volume, and any confirming indicators. This will help you spot trends and refine your ability to filter out false signals by analyzing volume and follow-through price action.
As you gain confidence, increase your virtual capital and experiment with more advanced strategies. Take advantage of the platform's charting tools to overlay additional indicators that can confirm candlestick signals.
Finally, make sure to pair your pattern recognition with solid risk management practices.
Managing Trade Risk
To complement your pattern analysis, use disciplined risk management strategies, supported by For Traders' AI-powered TradeLocker. This tool helps enforce your rules and keeps emotions in check.
Here are some key risk management tips:
- Use a lot size calculator to adjust position sizes to match your personal risk tolerance.
- Place stop-loss orders just beyond the extreme of each pattern (e.g., below the low of a bullish engulfing candle).
- Use TradeLocker to stick to your entry and exit criteria without second-guessing yourself.
Benefits and Limits of Candlesticks
Candlestick Pros and Cons
Once you've practiced in demo trading, it's important to recognize where candlesticks perform well and where they might fall short.
Advantages:
- Provide quick, visual insights into price movements
- Easily highlight key levels of support and resistance
Limitations:
- Patterns don't guarantee specific outcomes
- Can produce false signals in highly volatile markets
- Work best in markets with high trading volume and liquidity
Balancing these strengths and weaknesses is essential for effective trading. Candlestick patterns can offer useful insights, but they should always be part of a broader analysis strategy, not the sole tool you rely on.
Best Times to Use Candlesticks
Candlesticks are most effective in markets with high trading volume and strong liquidity. For day trading, focus on 1–5-minute charts. For swing trading, daily or weekly charts are more suitable. In 24/7 markets like cryptocurrency, stick to 1–30-minute intervals and avoid trading before major data releases.
The most reliable candlestick patterns tend to appear when:
- Trading volume is high, confirming the validity of patterns
- Markets have consistent price action with good liquidity
- There are no upcoming major data releases
- Other technical indicators align with the candlestick signals
While candlesticks are excellent for analyzing short-term price movements and spotting potential reversals, they shouldn't be your only decision-making tool. Incorporate them into a broader strategy and always prioritize strong risk management.
Summary
Learn how to read candlestick charts by focusing on their components, patterns, and confirmation techniques. Here's how to get started:
- Understand the parts of a candlestick and their color meanings.
- Identify major reversal and continuation patterns.
- Use trends, volume, and indicators to confirm signals.
- Practice using a demo account and keep a detailed trade journal.
- Establish clear entry, exit, and stop-loss rules before trading.
Once you're ready, open a demo chart and put these steps into practice.
Related Blog Posts
Start Trading with For Traders
Join our platform to test your trading skills, trade virtual capital, and earn real profits. Access educational resources, advanced tools, and a supportive community to enhance your trading journey.
Start your Trading Challenge