The Importance of Backtesting Your Trading Strategy
Backtesting a trading strategy the right way: metrics, software, bias traps and how to validate before a prop challenge. Full 2026 guide for serious traders.

By Marcel Hambálek · Senior Trader, For Traders
Backtesting a trading strategy means running your rules against historical price data to measure how it would have performed — profit factor, drawdown, win rate, expectancy — before risking a single dollar or evaluation fee. Done properly it filters bad ideas; done sloppily it manufactures false confidence that dies the moment live spreads and slippage arrive.
Key takeaways
- Backtesting proves your rules had an edge on past data — not that they will work tomorrow.
- The metrics that matter are profit factor, max drawdown, sample size and expectancy — not win rate alone.
- Overfitting, look-ahead bias and survivorship bias are why most backtested strategies fail live.
- Walk-forward analysis and Monte Carlo simulation separate robust systems from curve-fitted illusions.
- For a prop challenge, aim for profit factor >1.5, max DD under half your allowed drawdown, and 100+ trades before you pay an evaluation fee.
- Forward testing on a simulated funded environment — like a For Traders challenge — is the honest bridge between backtest and live capital.
Watch: related video
What is backtesting in trading? Plain-English definition
Backtest meaning: the one-line answer
Backtesting a trading strategy means applying a fixed set of rules to historical OHLC data — open, high, low, close — and measuring what would have happened if you'd traded those rules over that period. Every entry, every exit, every stop, every target gets calculated against real past prices. The output is a performance record: win rate, profit factor, max drawdown, expectancy. You get all of that before you risk a single dollar or evaluation fee.
The mechanics are straightforward. You define your rules precisely enough that there's no ambiguity — "buy when the 20 EMA crosses above the 50 EMA on a closed 4H candle, stop below the prior swing low, target 2R" — then you run those rules across months or years of price history. The strategy either holds up or it doesn't. There's no room for hindsight once the rules are locked.
What a backtest actually proves (and what it doesn't)
This is where most traders trip up. A backtest proves that your rules had an edge in the historical sample you tested. That's it. It does not prove the edge will persist. Markets evolve — liquidity conditions change, volatility regimes shift, correlations break down. A strategy that printed 70% win rate on 2019–2022 XAUUSD data may behave completely differently in a different macro environment.
What a clean backtest genuinely gives you:
- Confirmation that the logic has a measurable historical edge — not just a feeling
- Realistic drawdown expectations so you can size positions without blowing up
- A baseline to compare against live performance — if live results diverge sharply, you know something changed
- The discipline of being rules-based, which is the actual skill being tested in any prop trading evaluation
What it doesn't give you: a guarantee. Anyone selling you a "100% backtested, never loses" system is selling you overfitting dressed up as edge. The more parameters you add, the more precisely a strategy fits past data — and the less reliably it trades forward.
Backtesting in forex vs stocks vs futures
The asset class you're testing on introduces specific data problems that can quietly wreck your results if you ignore them.
Backtesting in forex looks simple because data is everywhere, but spread is variable — the 1.2-pip EURUSD spread you see at 10am London is not the same as the 4-pip spread at 4am or during an NFP print. If your backtest uses a fixed spread, your results are flattering. Session overlap matters too: a breakout strategy that works in the London–New York overlap looks very different when it fires in the Asian session.
Futures introduce roll basis. Continuous contract data stitches together quarterly contracts, and the price adjustments at each roll can distort OHLC levels enough to generate false signals. Always check whether your historical futures data is back-adjusted or raw, and understand what that means for any price-level-based rules you're using.
Equities carry survivorship bias — most historical databases only include companies that still exist. If you backtest a stock-selection strategy on an index that's been cleaned of delisted names, you're testing on winners by definition. Your results will be inflated. This is less of a concern when trading index futures like the US100, but it matters significantly for individual stock strategies.
Know your data before you trust your results. The backtest is only as honest as the feed you run it on.
Why backtesting matters before a prop firm evaluation
Entering a prop firm evaluation with an unvalidated strategy is straightforward to price: you're paying a challenge fee to discover, in real time, that your edge doesn't exist. A backtest tells you whether your system has ever worked before you spend a cent finding out whether it works now.
The cost of an unproven system
Challenge fees are not trivial. Depending on the account size you're targeting, you could be paying anywhere from $50 to several hundred dollars per attempt. Most traders who fail evaluations don't fail because markets moved against them once — they fail because their system never had a statistically robust edge to begin with. The loss rate reflects this: industry-wide, the majority of evaluation attempts don't result in a funded account, and a significant portion of those failures come down to position sizing errors and drawdown mismanagement that a backtest would have flagged immediately.
Running your rules across two to five years of historical data — through at least one high-volatility regime, one trending market, and one choppy consolidation — gives you a sample size worth trusting. Fewer than 200 trades and you're reading noise. More than 500 trades across different market conditions and you're starting to see signal.
How backtest data shapes your risk parameters
This is where backtesting stops being abstract and starts being directly useful. Every prop firm evaluation comes with hard rules: a maximum drawdown limit, a daily loss limit, and a profit target. For Traders' evaluations, for example, structure these as concrete thresholds your account balance cannot breach — typically a 5% or 10% maximum drawdown depending on the challenge tier, with a daily loss limit sitting inside that.
Your backtest answers three questions that determine whether your strategy is even compatible with those rules:
- Does your worst historical drawdown fit inside the max DD rule? If your system's peak-to-trough drawdown over five years was 8%, and the challenge allows only 5%, you will breach the limit — not maybe, statistically will. You either need to reduce position sizing or accept that this system isn't suited to that tier.
- Does your daily loss profile match the daily limit? Some strategies have clustered losing days — three bad sessions in a row, each down 2%. If the daily limit is 4%, you survive. If it's 2%, one normal losing day ends your evaluation.
- How many trades do you typically need to hit the profit target? If your backtest shows an average of 60 trades to generate a 10% gain, and your strategy produces 4 trades per week, you know your evaluation timeline. If it shows 200 trades, you need to understand whether the challenge's time frame accommodates that pace.
These aren't hypotheticals. They're the exact numbers that separate traders who pass from traders who pay for the same lesson twice.
Matching strategy behaviour to challenge rules
Different strategies have radically different compatibility profiles with evaluation constraints. A high-frequency scalping approach on XAUUSD might generate strong raw returns but produce daily loss spikes that routinely touch the limit. A swing system trading US100 futures might have a smooth equity curve but require holding positions overnight — which interacts directly with any news-event restrictions or weekend holding rules in the challenge terms.
Before you submit your first evaluation fee, pull your backtest's daily P&L distribution, not just the summary metrics. Map each day's result against the challenge's daily loss limit. Count how many times in your historical sample you would have been stopped out by the rules rather than by the market. That number is your real failure rate — and it's the one worth fixing before you go live.
Position sizing is the lever. If your system's historical behaviour is structurally incompatible with the challenge rules at 1% risk per trade, test it at 0.5%. A lower risk-per-trade often brings your worst drawdown inside the permitted range without meaningfully reducing your profit factor. The backtest tells you exactly where that threshold sits.
Backtesting vs Forward Testing vs Live Simulation
Each validation method answers a different question, and using only one of them before going live is like checking the weather forecast but never looking out the window. The three stages form a pipeline — skip one and you leave a blind spot your real capital will eventually find.
Backtesting: Hypothesis on Cold Data
Backtesting runs your rules against historical price data that has already closed. Every candle, every spread, every swing high is fixed — the market can't surprise you, which is both its strength and its core limitation. The strength: you can test 10 years of XAUUSD price action in an afternoon and get statistically meaningful sample sizes across multiple market regimes — trending, ranging, high-volatility FOMC windows, low-liquidity Asian sessions. The limitation: you already know what happened. Curve-fitting, look-ahead bias and survivorship bias all live here, quietly inflating your results if you're not disciplined about your methodology.
Use backtesting to filter. If a strategy can't produce a profit factor above 1.3 and a maximum drawdown within your challenge limits on cold historical data, it has no business moving to the next stage. Think of it as a cheap, fast elimination round — most ideas should die here.
Forward Testing: Same Rules, New Data
Forward testing — sometimes called walk-forward analysis or paper trading in real time — applies the exact same rule set to price data as it prints, one candle at a time. You are no longer looking at a fixed dataset; the market is generating new bars and you're executing your signals as they form. This is the critical bridge between a backtest and live capital.
The psychological difference is immediate. In a backtest you can pause, scroll, reconsider. In forward testing, the signal fires at 14:32 and you either take it or you don't. Hesitation, second-guessing and selective execution all show up here — and they should, because they'll show up in live trading too. A strategy that looks clean on historical data but that you consistently fail to execute correctly in forward testing is telling you something important about fit.
A minimum of 50–100 forward-tested trades across different market conditions gives you a meaningful read. Fewer than that and you're just sampling noise.
Live Simulation: Real Fills, Real Emotions
Live simulation on a prop trading challenge platform like For Traders adds the final layer: real spreads, real slippage, real execution latency, and — crucially — real psychological weight, even though the capital is simulated. Knowing that a drawdown breach ends your evaluation changes how you feel about a losing streak in a way that paper trading on a spreadsheet simply does not replicate. That pressure is the point. It stress-tests your discipline, not just your rules.
This is where walk-forward analysis meets execution reality. Strategies that survived backtesting and forward testing occasionally fall apart here because slippage on a fast-moving US100 open, or a widened spread during NFP on XAUUSD, erodes an edge that looked solid on paper.
| Method | Data Type | Execution Risk | Psychological Pressure | Best Used For |
|---|---|---|---|---|
| Backtesting | Historical (fixed) | None | None | Filtering ideas; measuring profit factor, drawdown, expectancy |
| Forward Testing | Live (unseen, paper) | None | Low–Medium | Validating rules on new data; spotting execution hesitation |
| Live Simulation | Live (real fills) | Real spreads & slippage | High | Final stress-test; challenge-condition readiness |
Run them in sequence. A strategy that clears all three stages has been genuinely stress-tested — not just optimised to look good on a chart you've already memorised.
How to backtest a trading strategy: the step-by-step workflow
A backtest is only as reliable as the process behind it. Follow these five steps in order — skip one and you're not backtesting, you're storytelling.
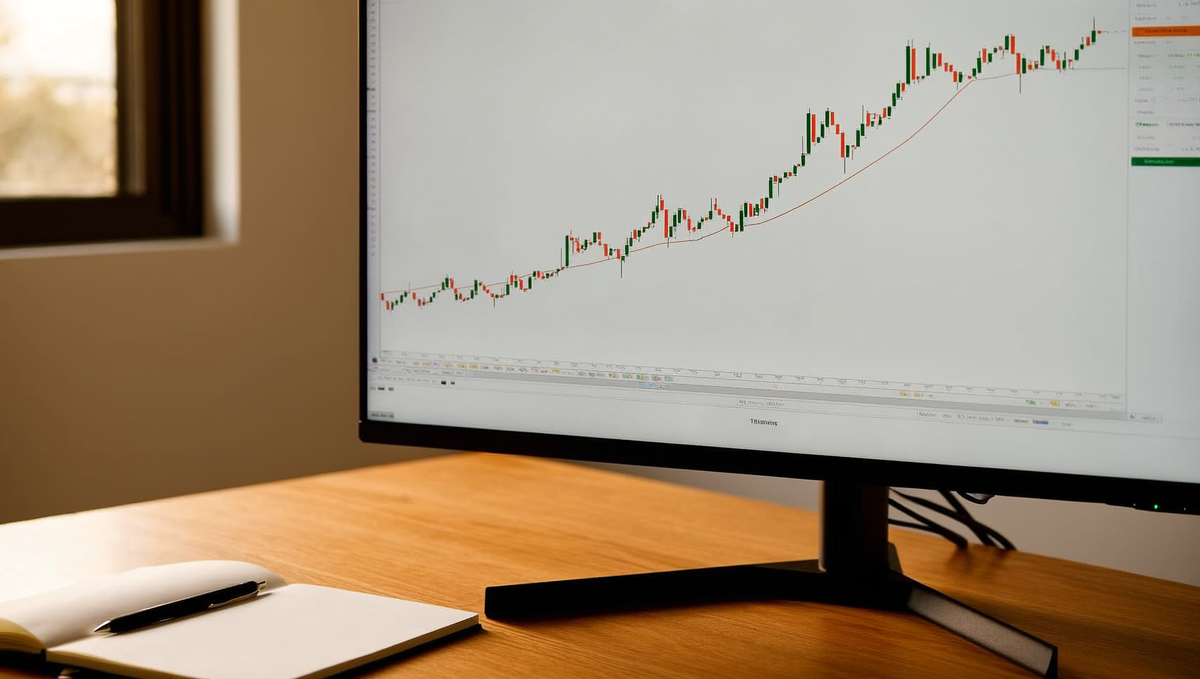
Step 1 — Define rules that a computer could follow
Before you touch a single bar of historical data, write your rules in plain, unambiguous language. "Enter long when the 20 EMA crosses above the 50 EMA on the 1H chart, RSI is between 40 and 60, and the previous candle closed above the 20 EMA" is a rule. "Enter when it looks strong" is an opinion — and opinions can't be backtested, only rationalised after the fact.
Every condition needs a precise trigger: which timeframe, which indicator setting, which candle (close or intrabar?), which direction. If you can't hand your ruleset to a developer and have them code it without asking a single clarifying question, tighten it further. Vague rules produce backtests that flatter you because your brain fills the gaps with hindsight.
Step 2 — Source clean historical data
Garbage data produces garbage results. For intraday forex and gold (XAUUSD), you need a minimum of two to three years of tick or M1 data to cover multiple volatility regimes — at least one risk-off shock, one trending grind, and one choppy range. For swing strategies on daily charts, extend that to five years or more. Your backtest should include an FOMC cycle, an NFP surprise, and ideally a liquidity crisis — not just the benign stretches where every system looks brilliant.
Source data from your actual execution environment where possible. Spreads on gold at 3:00 AM GMT are not the same as spreads at the London open. If your data doesn't reflect that, your cost model won't either.
Step 3 — Run the test with realistic costs
Spread, commission, and slippage are not optional line items. On a 10-pip target, a 1.5-pip spread plus 0.5-pip slippage is a 20% drag before the market moves a tick in your favour. Model every trade with the full round-trip cost: spread at entry, spread at exit, commission per lot, and a conservative slippage assumption — at least 0.5 to 1 pip for liquid forex pairs, more for gold during news events. A strategy that looks profitable gross but bleeds out net is telling you something important: the edge is too thin for real conditions.
Step 4 — Split in-sample and out-of-sample
This is the step most traders skip, and it's why their backtests don't survive first contact with live markets. Use 70–80% of your historical data to develop and optimise your rules (in-sample), then run the untouched remainder (out-of-sample) as a blind test. If performance degrades significantly on the out-of-sample slice, you've curve-fitted — your parameters describe the past, not an edge. A genuine edge survives both windows. The out-of-sample result is your honest number; the in-sample result is just the tuning bench.
Step 5 — Log every trade for post-mortem
A backtest without a trade log is just a summary statistic you can't interrogate. Record every trade: entry price, exit price, direction, size, gross P&L, net P&L after costs, and the R-multiple (how many times your initial risk did this trade return or lose). From that log you can compute two numbers that matter more than win rate alone: expectancy (average R per trade across the full sample) and your R-multiple distribution (the shape of your wins and losses). A positive expectancy — say, +0.25R per trade — means the system makes money over a large sample even with a sub-50% win rate. That's the number you're building toward. Without the log, you can't calculate it.
The backtesting metrics that actually matter
Not every number your backtesting software spits out deserves equal attention. The metrics below are the ones that tell you whether a system is tradable, whether it fits a prop challenge's rules, and whether you're looking at genuine edge or statistical noise.
Profit factor and expectancy
Profit factor is gross winning trades divided by gross losing trades. A profit factor of 1.0 means you broke even before costs. A tradable system sits above 1.5; above 2.0 is genuinely strong. Anything under 1.3 is fragile — a modest shift in market conditions or a few extra pips of spread erases it entirely.
Expectancy, as covered in the previous section, is your average R earned per trade across the full sample. A system with a 0.25R expectancy generates £250 of edge for every £1,000 risked per trade, compounded over hundreds of executions. These two numbers — profit factor and expectancy — are the core diagnostic pair. If both are healthy, everything else is context.
Maximum drawdown and drawdown duration
Maximum drawdown tells you the worst peak-to-trough loss the system produced historically. Drawdown duration tells you how long it took to recover. Both matter, because a system that drops 18% and recovers in two weeks is a very different psychological and practical challenge than one that drops 8% and grinds sideways for four months.
The prop challenge rule is simple: your system's worst historical drawdown must fit inside the challenge's allowed drawdown with meaningful headroom. If a challenge permits a 10% maximum drawdown, target a system whose historical worst is under 5%. That buffer absorbs the reality that live performance — with real spreads, slippage, and emotional execution — almost always underperforms a clean backtest.
Win rate, R-multiple and the sample size problem
Win rate in isolation is one of the most misleading numbers in trading. A 70% win rate sounds impressive until you discover the average winner is 0.4R and the average loser is 1.8R — that system is bleeding money. Conversely, a 30% win rate paired with a 3R average winner is solidly profitable. Always read win rate alongside your R-multiple distribution. The shape of that distribution — how fat the winning tail is, how contained the losing tail is — defines whether the edge is real.
Then there's sample size. Fewer than 100 trades and you're looking at noise dressed up as data. The minimum threshold for meaningful backtesting metrics is 100 trades; 300 or more is where statistical confidence actually starts to hold. If your setup only triggers twice a month, that means years of data before the numbers are trustworthy — which is exactly why traders rush this step and pay for it later.
Sharpe ratio and risk-adjusted returns
The Sharpe ratio measures return per unit of volatility. A Sharpe above 1.0 is acceptable; above 2.0 suggests a system with smooth, consistent equity growth rather than a lumpy, high-variance curve. It matters because two systems can share identical profit factors while one produces a near-straight equity curve and the other swings wildly — the volatile one will break your discipline long before it breaks your account.
Use the Sharpe ratio as a tiebreaker and a sanity check, not a primary filter. A very high Sharpe on a 50-trade sample is meaningless. A modest Sharpe on 400 trades tells you something real.
| Metric | Minimum threshold | Strong benchmark | What it reveals |
|---|---|---|---|
| Profit factor | >1.5 | >2.0 | Gross edge after losses |
| Expectancy | >0R (positive) | >0.25R per trade | Average return per unit risked |
| Maximum drawdown | <50% of allowed DD limit | <5% on a 10% DD challenge | Worst-case capital erosion |
| Win rate | Read alongside R-multiple | 30%+ WR with 3R avg winner | Hit frequency (context-dependent) |
| Sample size | 100 trades minimum | 300+ trades | Statistical validity of all metrics |
| Sharpe ratio | >1.0 | >2.0 | Return smoothness vs. volatility |
Ready to trade funded capital?
Choose your path — Instant Accounts, One-Step or Two-Step Challenges — from just $23, with up to $300,000 in funded capital.
Choose your challengeOverfitting: why your beautiful backtest will die in live conditions
Overfitting in backtesting — also called curve fitting or optimization bias — happens when you tune a strategy so precisely to past data that it stops being a trading system and becomes a historical description. The equity curve looks immaculate. The Sharpe ratio is absurd. And then the market moves one tick differently from 2019, and the whole thing collapses.
What overfitting looks like on an equity curve
You know an overfit system when you see one — you just need to know what to look for. The tell-tale signs aren't subtle once you've burned yourself once:
- The equity curve is too smooth. Real trading has clusters of losses. If your backtest shows a near-diagonal line upward with drawdowns never exceeding 3%, something is wrong. Markets are not that kind to any system, ever.
- Sharpe ratio above 3.0 on a discretionary-style system. A Sharpe above 2.0 is already elite territory for a robust strategy. If yours is 4.7, you've probably curve-fitted around every bad period in the sample.
- Sensitivity collapse on a 1-pip parameter change. This is the most damning test. Change your moving average from 21 to 22, or your ATR multiplier from 1.5 to 1.6, and watch what happens. If the profit factor drops from 2.1 to 0.9, you don't have a strategy — you have a historical artefact.
- Performance that's suspiciously period-specific. The system crushes 2020–2022 (volatile, trending) but flatlines on any other sample. That's not edge — that's regime dependency dressed up as alpha.
Strategy tuning gone wrong
There's a legitimate version of strategy tuning: you test a parameter, observe the logic, adjust based on why the market should respond to that level. Then there's optimization bias — running 10,000 parameter combinations through a backtesting engine and picking whichever produced the highest return. The second approach is statistically guaranteed to find something that looks great. It's also statistically guaranteed to fail forward.
Every parameter you add to a system costs you degrees of freedom. A strategy with three rules and two parameters, tested on 500 trades, has genuine statistical weight. A strategy with eleven parameters optimized across the same 500 trades has memorized the data. The more levers you've pulled to make it fit, the less it's telling you about the market and the more it's telling you about those specific 500 trades.
Walk-forward testing exists precisely to expose this. Split your data: optimize on the in-sample period, then run the out-of-sample period untouched. If performance degrades sharply — not moderately, but sharply — you've overfit. Moderate degradation is expected and honest. A strategy that returned 4R per month in-sample and returns 0.8R out-of-sample is still alive. One that goes from 4R to negative 1.2R has told you everything you need to know.
The William Eckhardt principle: robust beats optimal
William Eckhardt, one of the original Turtle traders and a mathematician before he was a trader, articulated something that every systematic trader should tattoo somewhere visible: a robust system beats an optimal one every time, because optimal is a historical fiction and robust is a forward-looking reality.
What Eckhardt understood — and what the optimization-bias trap ignores — is that the market you're about to trade has never existed before. The parameters that maximized return on 2018–2023 XAUUSD data are the parameters that were best for a world that no longer exists. Robust parameters are ones that work across a range of values, across multiple instruments, across different volatility regimes. If your strategy works on gold, holds up reasonably on US100, and doesn't completely fall apart on EUR/USD, that's signal. If it only works on XAUUSD with a 14-period RSI and a 1.47× ATR stop, that's noise wearing a backtest.
Test for robustness deliberately: perturb every parameter by ±20% and measure the performance decay. If the system degrades gracefully, you have something. If it falls off a cliff, keep digging.
The bias glossary: hidden traps that inflate every backtest
Backtesting analysis fails most traders not because their strategy is wrong, but because their test is lying to them. Every bias below inflates your historical results in a way that's invisible until you're live and bleeding.
Look-ahead bias
Look-ahead bias means your backtest uses information that wasn't available at the moment the trade decision had to be made.
The classic example: you use a day's closing price to trigger an entry that executes at that same close. In reality, you can't know the close until the candle is finished — and by then, the fill is gone. A moving-average crossover strategy that signals on the 4pm close and "enters" at 4pm has already used the future to make the past look brilliant. The same trap appears in fundamental backtests when you apply quarterly earnings data on the report date rather than the date it was publicly filed. One rule: your signal timestamp must always precede your entry timestamp by at least one bar, or one confirmed tick if you're working intraday futures.
Survivorship bias
Survivorship bias occurs when you only test on assets that survived long enough to still be in your dataset today.
Run a mean-reversion strategy on the current S&P 500 constituents going back to 2010 and you've already excluded every company that went bankrupt, got delisted, or was quietly dropped from the index over that period. Those are exactly the stocks a mean-reversion system would have bought on the way down — and held to zero. Point-in-time constituent data from index providers corrects this, but most retail data feeds don't include it by default. If you're testing on equities or sector ETFs, verify whether your data provider reconstructs historical membership or simply gives you today's list.
Data-snooping and multiple-testing bias
Data-snooping bias — also called multiple-testing bias — is what happens when you run 200 parameter combinations, find the one that returned 180% with a 0.4% max drawdown, and report that as your strategy's performance.
You haven't discovered a robust edge; you've curve-fitted to noise. With enough combinations, any random dataset will produce a handful of spectacular-looking results by pure chance. The fix is straightforward but uncomfortable: define your parameters before you look at the results, use a holdout out-of-sample period you genuinely haven't touched, and apply a Bonferroni-style penalty — if you tested 100 variations, your threshold for calling a result meaningful needs to be proportionally higher. One combination, tested once, on data you haven't peeked at, is worth more than 500 optimised runs on the same in-sample window.
Postdictive errors in technical analysis
This is one of the most underappreciated challenges in backtesting technical analysis strategies: postdictive errors arise when an indicator repaints — meaning its historical values change as new bars arrive.
Certain oscillators and volume-weighted indicators recalculate backwards across the visible chart window. When you visually inspect them on a live chart, the signals look clean and precise. When you code them into a backtest using the current calculated values rather than the values that existed bar-by-bar in real time, every signal is technically drawn with future data. Zigzag indicators are the textbook offender — the final pivot is always confirmed after the fact. Before you commit any indicator to a systematic backtest, check its source code or documentation for the words "lookahead" or "offset," and verify that the value at bar n was truly computable using only data through bar n. If you can't confirm that, the indicator has no place in a rigorous backtesting trading strategy.
Walk-forward analysis and Monte Carlo: advanced validation
A clean backtest on historical data tells you your strategy could have worked — walk-forward analysis and Monte Carlo simulation tell you whether it's likely to keep working under conditions you haven't seen yet. These two tools are where rigorous backtesting analysis separates genuinely robust strategies from beautifully curve-fitted ones.
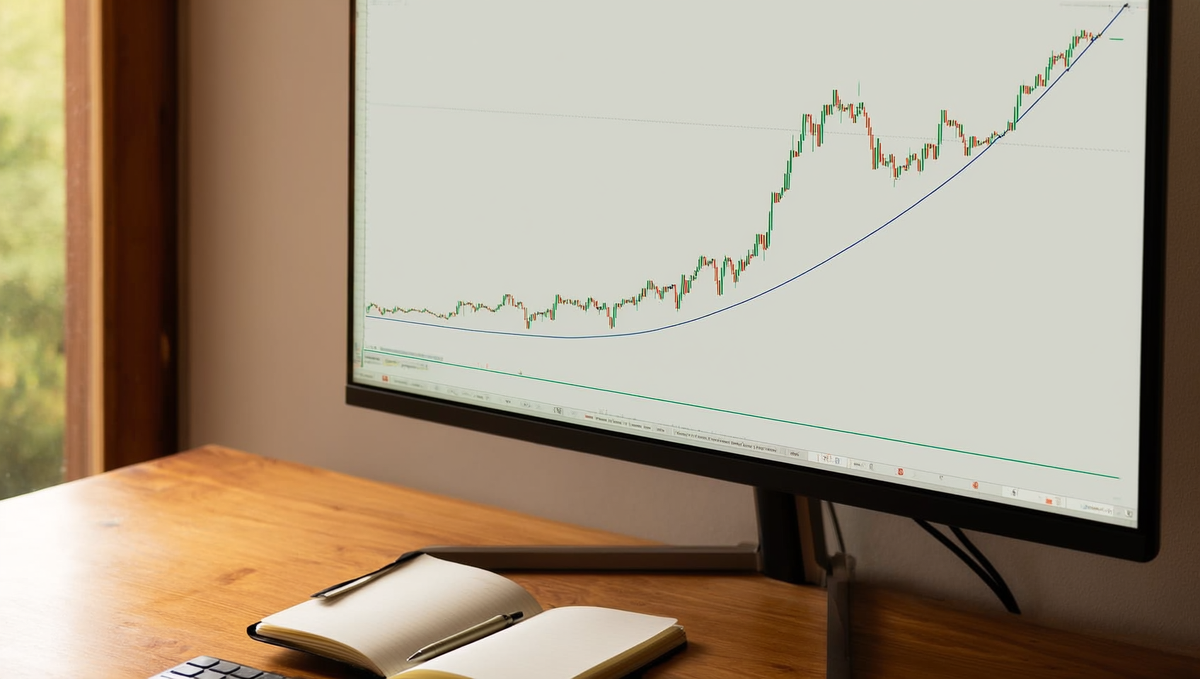
Walk-forward: rolling optimisation with out-of-sample checks
The idea is straightforward, even if the execution takes discipline. You divide your historical data into consecutive windows — say, twelve months of in-sample data followed by three months of out-of-sample data. You optimise your parameters on the first window, then test the resulting settings on the next unseen window. Then you roll forward, repeat, and stack the out-of-sample results into a single equity curve.
That stacked curve is the honest one. Each segment was traded with parameters the strategy had never seen before — which is exactly the situation you face on day one of a live evaluation. If the walk-forward equity curve degrades badly relative to your in-sample runs, you have an overfitting problem, not a trading edge. A strategy that survives rolling out-of-sample checks has demonstrated at least some ability to generalise. One that only looks good on a single optimised run has demonstrated nothing except that parameters can be tuned to fit noise.
A practical threshold many systematic traders use: the walk-forward efficiency ratio (out-of-sample profit factor divided by in-sample profit factor) should sit above 0.5. Below that, the strategy is leaning too hard on historical quirks that won't repeat.
Monte Carlo simulation: stress-testing trade order
Your backtest produces one sequence of trades in one specific order. Monte Carlo simulation asks: what happens if those same trades arrive in a different order? The engine shuffles your trade log thousands of times — sometimes clustering your worst losses at the front, sometimes stringing together your best runs — and plots the resulting distribution of equity curves.
What you're looking for is the 5th-percentile outcome: the equity path that only 5% of simulations fall below. If that path breaches your maximum drawdown threshold, your strategy carries more tail risk than a single backtest suggests. A well-constructed Monte Carlo run on a 500-trade log might show that while your median outcome is a 15% drawdown, the 5th-percentile scenario hits 28% — a number that ends most prop challenges before variance has time to recover.
This matters more in a funded evaluation context than almost anywhere else. In live trading with your own capital, a brutal early drawdown is painful but survivable if you have time and discipline. In a challenge with hard daily loss limits and a maximum drawdown ceiling, a bad sequence of losses in the first two weeks can terminate the account before your edge has had a fair chance to express itself. Monte Carlo quantifies that specific risk — not just whether your strategy wins on average, but whether it survives the unlucky orderings.
What advanced tests reveal that a simple backtest hides
A standard backtesting analysis run gives you one number: how the strategy performed on one historical path. Walk-forward and Monte Carlo together reveal the distribution of possible outcomes. Specifically, they surface three things a simple backtest buries:
- Parameter fragility — if small changes to your inputs collapse performance across walk-forward windows, the strategy has no robust zone. It only worked at one specific setting because that setting was tuned to the past.
- Sequence risk — Monte Carlo exposes how badly a losing streak early in the evaluation can damage you even when the long-run expectancy is positive. A 10-trade losing streak that occurs in month three is manageable; the same streak in week one is account-ending.
- Probability of ruin — by counting what percentage of Monte Carlo paths hit your maximum drawdown limit before reaching the target profit, you get an honest ruin probability. If 18% of simulated paths fail the challenge before passing it, you need to either reduce position sizing or accept that the strategy needs more development before it's evaluation-ready.
Run both tests before you pay an evaluation fee. The data they produce is uncomfortable reading sometimes — but that discomfort is the point. Better to find the fragility in simulation than at the $200,000 account level.
Backtesting software: what serious traders actually use
The tool you choose shapes what questions you can even ask of your data. A visual bar-replay on TradingView answers different questions than a Monte Carlo simulation in Python — and neither is universally better. Match the tool to the problem, not to what your trading group happens to use.
TradingView Strategy Tester and Pine Script
TradingView is where most retail traders start, and for good reason: the feedback loop is fast. You write a Pine Script strategy, hit "Add to chart", and within seconds you're looking at equity curves, max drawdown, and trade-by-trade logs across any instrument in their library — including XAUUSD, US100, and crypto pairs. For a first-pass filter on whether an idea has any edge at all, it's genuinely hard to beat on speed.
The honest limitation: TradingView's bar-based backtesting engine does not use tick data by default. On timeframes below the 1-hour, intra-bar price path assumptions introduce meaningful error — especially on strategies with tight stops. If your stop is 8 pips wide on a 5-minute chart, the tester may not accurately model whether price touched it before reversing. The "recalculate on every tick" option helps but doesn't fully solve this. Use TradingView for directional hypothesis testing, not for final position-sizing decisions.
MetaTrader Strategy Tester (MT4/MT5)
MetaTrader's Strategy Tester is the industry standard for forex and CFD systematic strategies, largely because it supports real tick data import when paired with services like Tickstory or Dukascopy's free historical feed. With 99% modelling quality tick data, you get accurate spread simulation, swap costs, and realistic fill behaviour — the things that actually kill strategies when they go live.
MT5's Strategy Tester adds multi-symbol and multi-timeframe testing in a single pass, which matters if your strategy uses a confirmation signal from a higher timeframe or a correlated pair. The downside is that Pine Script is faster to iterate; MQL4/MQL5 has a steeper learning curve and the IDE is showing its age. Still, if you're running an EA or a rules-based system on forex or gold, MetaTrader is where you validate it properly.
Python backtesting libraries — Backtrader, VectorBT, Zipline
Python is where the ceiling disappears. Three libraries dominate:
- Backtrader — event-driven, highly flexible, supports live trading connections. Best for strategies with complex logic, custom indicators, or multi-asset portfolio rules. Slower to run than vectorised alternatives.
- VectorBT — vectorised on top of NumPy/Pandas, which means it runs thousands of parameter combinations in seconds. Built for walk-forward optimisation and Monte Carlo simulation at scale. Steep initial setup; once you're in, the analytical depth is unmatched.
- Zipline — originally Quantopian's engine, now community-maintained. Strong for US equities and futures with point-in-time data handling. Less actively developed than VectorBT but well-documented for portfolio-level research.
For traders running systematic strategies across multiple instruments or stress-testing with Monte Carlo methods, Python is the only realistic option. For everyone else, it may be overkill.
Choosing based on your asset and skill level
Here's the honest map:
| Tool | Best for | Tick accuracy | Skill floor | Cost |
|---|---|---|---|---|
| TradingView Strategy Tester | First-pass idea testing; discretionary replay | Low–Medium | Low (Pine Script is approachable) | Free–$60/mo |
| MetaTrader Strategy Tester (MT4/MT5) | Forex, gold, CFD EAs with real tick data | High (with imported data) | Medium (MQL4/5) | Free |
| Backtrader (Python) | Multi-asset, complex logic, live-ready strategies | Depends on data source | Medium–High | Free (open source) |
| VectorBT (Python) | Parameter optimisation, Monte Carlo, portfolio research | Depends on data source | High | Free / Pro tier available |
| Zipline (Python) | Equities and futures, portfolio-level backtests | Depends on data source | High | Free (open source) |
If you're a discretionary pattern trader who doesn't code, bar-replay mode in TradingView — where you manually step through historical bars and make decisions in real time — is more honest than any automated backtest you could run, because it tests you, not just the rules. If you're building a systematic strategy that you intend to run through a funded evaluation, graduate to MetaTrader or Python before you commit capital to the challenge. The extra setup time is nothing compared to a failed evaluation built on shallow data.
Why your backtested strategy keeps hitting stop losses in live trading
The most common reason a backtested strategy underperforms live is simple: your backtest assumed fills you will never actually get. Spread, slippage, session liquidity, and your own psychology are the four variables that eat the gap between a beautiful equity curve on a spreadsheet and a real funded account in drawdown.
Before you conclude the strategy is broken, run a proper diagnosis. Most of the time the strategy is fine — the model around it is what's leaking.
Spread, slippage and the fills you didn't model
Historical data is almost always mid-price. Your backtest bought and sold at the exact midpoint between bid and ask, every single time, with zero delay. Live trading doesn't work that way. On XAUUSD during a quiet London session you might see a 20–25 point spread. During an FOMC announcement that spread can blow out to 80–150 points in under a second — exactly when your stop-loss order is sitting in the book waiting to be triggered.
If your system targets 15 pips of profit on a 10-pip stop, a 3-pip spread alone flips your R:R from 1.5:1 to something that barely breaks even. Add realistic slippage on stop-outs — especially on fast-moving instruments like US100 or gold — and the edge your backtest found can disappear entirely.
The fix: rebuild your backtest with ask-side entries and bid-side exits. Add a fixed slippage assumption of at least 1–2 ticks on every stop fill, more on news bars. If the strategy survives that friction, it has a real edge. If it doesn't, you found out cheaply.
Session and liquidity effects your data missed
A strategy that looks clean on daily closes can be a mess intraday. Many retail datasets use 1-minute OHLC bars, which hide what actually happened inside that candle. A stop at 2,320.00 on gold might appear safe on the close — but the low of that minute bar touched 2,318.40 before recovering, and your stop was at 2,319.50. You got filled. The backtest didn't notice.
Session transitions are particularly brutal. The first 15 minutes of the New York open and the overlap with London see spreads widen, liquidity fragment, and price discovery accelerate. If your strategy was optimised on mid-session data but you're taking trades at the open, you're running a different strategy than the one you tested. Match your live trading hours exactly to the data window you backtested — or explicitly model the session open as a separate regime.
Psychology: the variable no backtest contains
Here's the honest one. Your backtest executed every signal. You won't. After three consecutive stop-outs, you'll skip the fourth trade — which in your backtest was the winner that recovered the drawdown. Or you'll take a trade your rules don't actually support because you're chasing the loss and the setup "looks close enough."
A Monte Carlo simulation across your backtest results will show you the realistic range of consecutive losses your system produces. If your strategy has a 45% win rate, a streak of six losers in a row isn't a malfunction — it's statistically normal and will happen multiple times per year. Check your Monte Carlo range before you decide the strategy is broken. The question isn't whether drawdown happens; it's whether the drawdown you're experiencing sits inside the expected distribution or outside it.
If it's inside the range, the problem is execution discipline, not strategy validity. If it's outside — if live performance is consistently worse than even the worst Monte Carlo path — then you have a genuine model failure, and the spread and slippage audit above is where you start.
From backtest to funded account: validating on a prop challenge
A backtest tells you what your strategy could do under controlled historical conditions. A prop firm evaluation tells you what it actually does under real spreads, real psychology, and hard daily loss limits. The two tests are complementary — run both, in that order.
Once your backtest clears the Monte Carlo filter and your spread audit checks out, the logical next step is a simulated funded environment where the constraints are fixed and the feedback is immediate. That environment is exactly what a Trading Challenge on For Traders is designed to be.
Translating backtest risk into challenge rules
Your backtest already knows your average risk per trade expressed as an R-multiple. The job now is to map that R onto the evaluation's hard limits before you place a single order.
For Traders challenges run on simulated virtual accounts ranging from $6,000 to $100,000, with a 5% maximum drawdown and a 5% daily loss limit. Those two numbers are not suggestions — breaching either one ends the evaluation. So treat them as the outermost boundary your backtest must respect, not as a worst-case afterthought.
Start with the overall max drawdown. If your backtest shows a maximum peak-to-trough equity drop of 3.8% across ten thousand simulated paths, you have a comfortable buffer inside the 5% ceiling. If the worst Monte Carlo path touched 4.9%, you are one bad week from failing before your strategy even gets a fair sample. In that case, reduce risk per trade until the worst simulated path sits at or below 4% — giving yourself a full percentage point of margin for the execution slippage that backtests underestimate.
Position sizing under a daily loss limit
The daily loss limit is the constraint most traders undersize their thinking around. On a $25,000 simulated account, 5% daily limit means you cannot lose more than $1,250 in a single trading day — regardless of how many trades you take.
Here is the practical conversion. If your backtested strategy risks 0.5% per trade, that is $125 per trade on a $25,000 account. You can absorb up to ten consecutive full losses in a single day before hitting the limit — which almost never happens, but the math gives you a clear ceiling. If you risk 1% per trade ($250), five losses breach the limit. If your strategy's maximum historical losing streak over any rolling five-day period is three trades, then 1% risk keeps you safe. If it's six, you need to drop to 0.5% or tighten your daily trade cap.
Run this calculation explicitly for every account size you are considering. The numbers change; the discipline of running them does not.
Using For Traders simulated capital as a live-fire test
The prop firm evaluation is the best stress test your strategy will ever face before real capital is involved. You are trading on simulated funded capital, so your personal money is not at risk — but the psychological pressure of a live account number moving against you, with a hard daily limit sitting overhead, is real in a way no paper-trading session ever replicates.
Think of the For Traders Trading Challenge as the final validation layer in your testing pipeline: historical data first, Monte Carlo second, spread audit third, and then simulated funded evaluation fourth. Each layer filters a different failure mode. The evaluation specifically filters for execution discipline and psychological consistency — the two things a backtest structurally cannot measure.
Traders who arrive at the challenge with a fully backtested strategy, position sizing already calibrated to the 5% drawdown framework, and a documented edge know exactly what they are looking for during the evaluation: confirmation that live performance sits inside the distribution their backtest predicted. That is a fundamentally different mindset from hoping the challenge goes well — and across For Traders evaluations, it is the mindset that separates traders who pass from those who repeat.
Ready to trade funded capital?
Choose your path — Instant Accounts, One-Step or Two-Step Challenges — from just $23, with up to $300,000 in funded capital.
Choose your challengeFrequently Asked Questions
What is backtesting in trading and what does it prove?+
Backtesting is the process of applying a trading strategy to historical price data to measure how it would have performed. It proves whether your rules — entry triggers, stop placement, position sizing — had a statistical edge over a defined sample of market conditions. What it cannot prove is that the edge will persist in live markets unchanged. Think of it as evidence, not a guarantee: a strategy with a 60% win rate and 1:2 R:R across 500 historical trades is worth testing live; one with 10 trades is not.
What does backtesting mean in forex specifically?+
In forex, backtesting means running your currency pair strategy — whether trend-following, mean-reversion, or news-driven — against tick or OHLC historical data to measure win rate, drawdown, and expectancy. Forex-specific nuances matter: spread widens during low liquidity, rollover costs accumulate on overnight positions, and major pairs behave differently around FOMC and NFP releases. A backtest that ignores variable spreads will overstate profitability, particularly on scalping strategies where the edge can be thinner than the average spread.
Why is backtesting important before a prop firm challenge?+
Prop firm challenges have hard rules — daily loss limits, max drawdown caps, minimum trading days — that punish undisciplined strategies fast. Backtesting before your challenge tells you whether your strategy's historical drawdown profile fits inside those rules without forcing you to deviate mid-challenge. If your backtest shows a maximum consecutive loss run of 6%, but the challenge's max drawdown is 8%, you know your buffer is thin and your position sizing needs adjusting before you start, not after you've already burned half the account.
What are the most important metrics to check in a backtest?+
Expectancy, max drawdown, and profit factor are the three you can't skip. Expectancy (average R per trade) tells you whether the edge is real. Max drawdown tells you the worst capital erosion the strategy produced historically — critical for sizing within prop firm rules. Profit factor above 1.5 is a reasonable minimum threshold. Beyond those three, look at Sharpe ratio for risk-adjusted return, consecutive losing trades to stress-test your psychology, and trade distribution across market conditions to spot if the edge is regime-dependent.
How do you avoid overfitting when tuning a strategy backtest?+
Overfitting happens when you curve-fit parameters to historical noise rather than genuine market structure. The practical fix is walk-forward testing: optimise your parameters on an in-sample period, then validate on out-of-sample data you haven't touched. If performance collapses on the out-of-sample window, the strategy is overfit. Keep your parameter count low — every additional variable you tune is another opportunity to fit noise. A strategy with two clean rules that works across multiple instruments and timeframes is more robust than one with seven filters that only works on EURUSD in 2023.
Why does a backtested strategy keep hitting stops in live trading?+
The gap between backtest and live performance usually comes from execution differences, not a broken strategy. Historical backtests assume fills at the exact candle close or signal price; live trading means slippage, requotes, and spread spikes — especially around news. If your backtest used mid-price data and your live broker charges a 2-pip spread, every entry is already 2 pips underwater. Run your backtest with realistic spread assumptions, add a slippage buffer, and forward-test on a demo account before committing real challenge capital.
How much historical data do you need for a reliable backtest?+
The minimum meaningful sample is 200-300 trades generated across at least two to three years of data — enough to capture trending, ranging, and volatile regimes. For lower-frequency strategies that generate fewer signals, you may need five or more years to hit that trade count. Single-year backtests are almost always misleading because they capture one dominant market regime. For gold (XAUUSD) and US indices specifically, include at least one major risk-off period and one sustained trend to see how the strategy behaves under stress.
What is the difference between backtesting and forward testing?+
Backtesting applies your rules to historical data you already have; forward testing (also called paper trading or demo trading) applies those same rules to live, unfolding price action in real time without risking capital. Backtesting is faster and covers more market history, but it carries look-ahead bias risk. Forward testing is slower but eliminates that bias entirely — you genuinely don't know what the next candle will print. The most rigorous validation sequence is backtest first, then forward test on a demo account for at least 50-100 trades before entering a funded challenge.
What software should you use to backtest a trading strategy?+
The right tool depends on your strategy type and coding ability. MetaTrader 4/5 Strategy Tester is the most accessible for forex and gold strategies, with tick data available for higher accuracy. TradingView's Pine Script lets you backtest directly on charts with a low learning curve. For futures and more complex multi-asset strategies, NinjaTrader and TradeStation offer deeper data and execution modelling. Python with libraries like Backtrader or Vectorbt suits quant-oriented traders who want full control over logic and reporting. Whichever you choose, prioritise tick-level or at minimum one-minute data over daily OHLC.
How do you translate backtest results into live risk parameters?+
Start by identifying your strategy's historical max drawdown, then set your live risk-per-trade so that a repeat of that drawdown sequence stays within your challenge's max drawdown limit — with a safety buffer of at least 20-30%. If your backtest shows a 12% max drawdown at 2% risk per trade, but your challenge cap is 10%, you need to drop to roughly 1.5% risk per trade before you start. Also map your average trade duration against the challenge's minimum trading day requirement to confirm your strategy naturally satisfies it without forcing trades.
Written by
Marcel Hambálek
Senior Trader, For Traders
Marcel trades Futures and Forex day-trading setups on funded accounts and writes about the executional details most traders skip — order types, slippage, session timing, platform quirks on MT5 and NinjaTrader. Pragmatic, mechanics-first, no fluff.
Follow on LinkedInReady to trade funded capital?
Choose your path — Instant Accounts, One-Step or Two-Step Challenges — from just $49, with up to $300,000 in funded capital.
Choose your challengeTrade up to $300,000
Choose challenge