Futures Trading During Economic News Events
Futures trading during economic news events: how ES and NQ price the 8:30 ET data drop, what prop evaluation news rules allow, and how to size with trailing DD.
By Marcel Hambálek · Senior Trader, For Traders
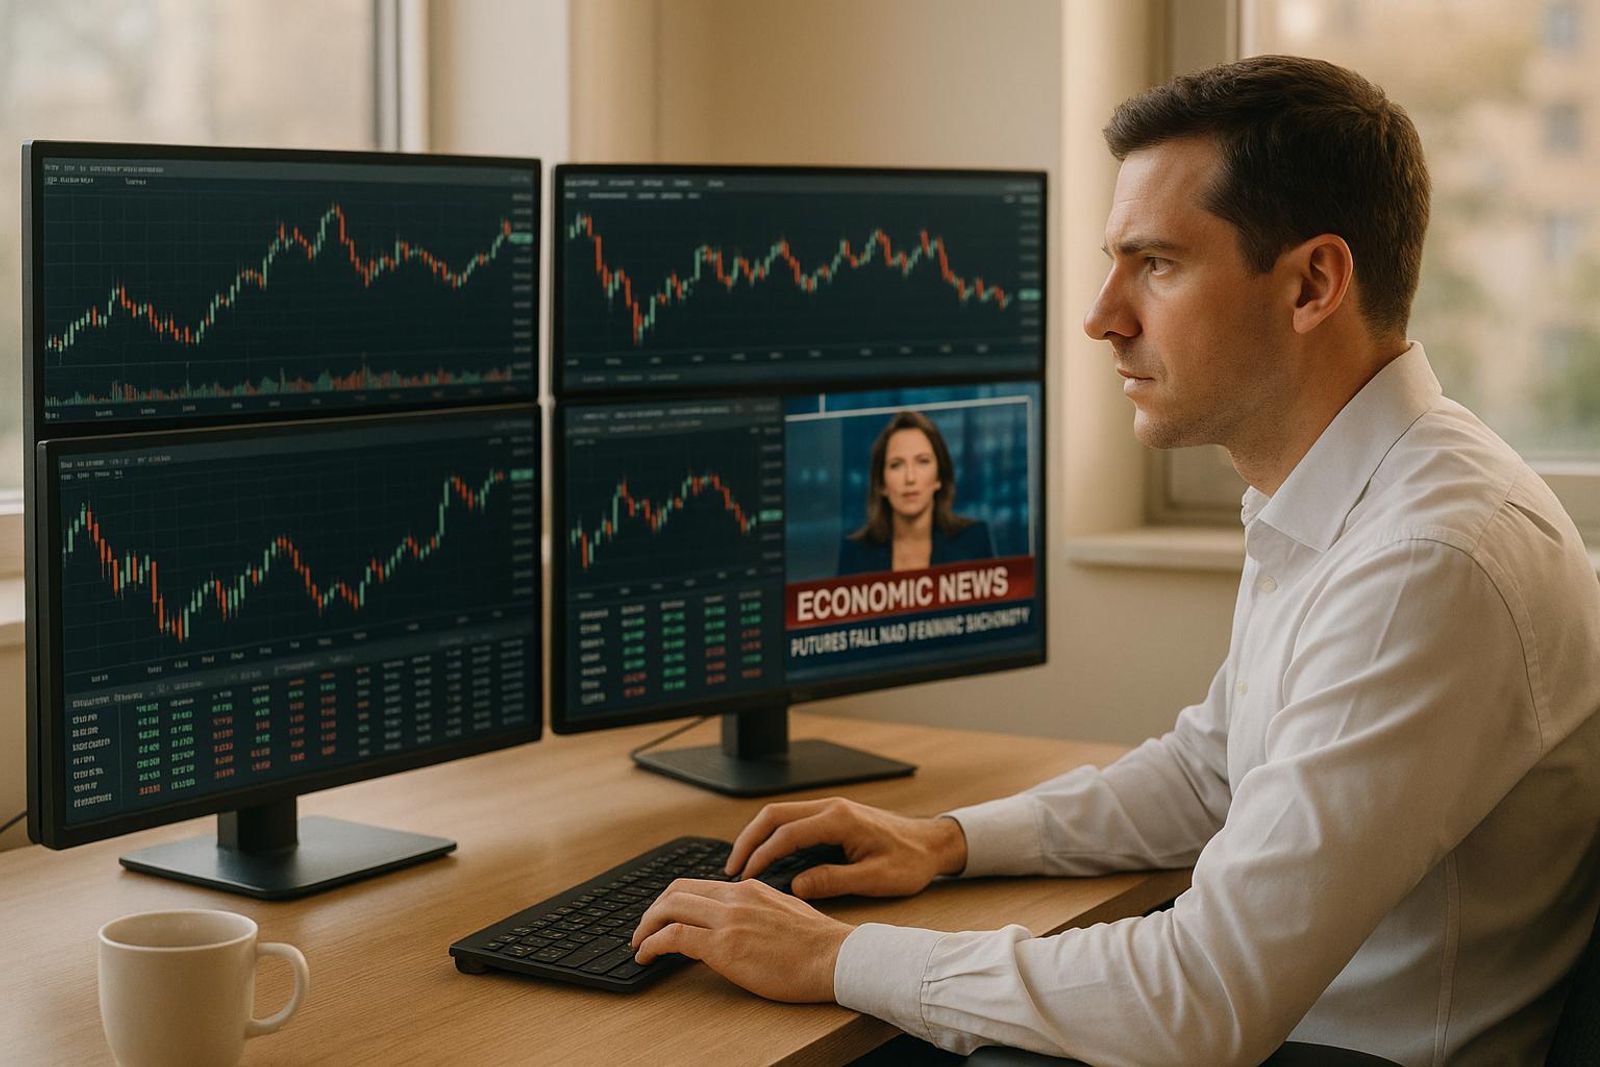
Futures trading during economic news events means taking positions in contracts like the E-mini S&P 500 (ES) or E-mini Nasdaq-100 (NQ) around scheduled macro releases — NFP, CPI, Core PCE and FOMC — which mostly hit at 08:30 ET, a full hour before the US cash equity market opens at 09:30 ET. Because CME Globex trades nearly 23 hours a day, index futures are the first printed price reacting to the data, and in the 30 seconds around the release the order book can thin by more than half, turning a 2-tick spread into an 8-tick fill.
Key takeaways
- Index futures are the first market to price a macro release because CME Globex is open at 08:30 ET while the cash equity market does not open until 09:30 ET.
- Volatility comes from the gap between consensus and actual, not the headline number — a 'bad' print in line with expectations often barely moves ES.
- In the 30 seconds around a release, resting liquidity is pulled, spreads widen and market orders can fill several ticks away from the last print.
- Most prop futures evaluations either restrict news trading outright or require reduced size around tier-1 releases, because slippage interacts badly with a trailing drawdown.
- Micro contracts (MES, MNQ, MGC) are the practical risk valve — they let you express a news view at roughly one-tenth the notional of the full-size contract.
- The highest-probability news trade is usually the second leg after the initial spike resolves, not the spike itself.
Watch: related video
Why do futures react to economic data before the cash market?
Futures move first because they're already open. CME Globex runs nearly 23 hours a day, so when the Bureau of Labor Statistics drops Nonfarm Payrolls at 08:30 ET, ES and NQ are the only liquid US equity exposure trading anywhere — the cash S&P 500 index sits frozen until the opening bell at 09:30 ET. By the time cash stocks print their first trade, futures have already absorbed an hour of repricing. This is the mechanical reason traders call index futures a leading indicator of economic shifts: they're not smarter than the cash market, they're just the only venue open.
The overnight session already holds a position on the print
Overnight ES and NQ volume isn't random noise. Asian and European desks build positioning into the 08:30 ET data release based on consensus estimates, overnight headlines, and whatever leaked ahead of the print. By 08:29 ET, the futures order book reflects a market that's already made a bet. When the actual number hits — payrolls beat, CPI cools, whatever it is — that positioning either gets validated or blown out in the first few seconds, which is exactly why the order book can thin by more than half right at the release.
08:30 ET vs 09:30 ET: the hour futures trade alone
For that full 60-minute window, ES and NQ are pre-market in every practical sense — no SPY arbitrage, no individual stock order flow, nothing to anchor price except futures order flow itself. This is the ES NQ pre-market window traders watch obsessively, because the move you see here is the move the cash open will inherit. Trading the 8:30 ET data release means accepting you're trading in a vacuum: no cash index to reference, no circuit breakers from the stock exchange, just futures finding a new fair value on thin liquidity.
How the cash open re-prices against the futures move
At 09:30 ET, the NYSE and Nasdaq opening auctions don't start from the prior day's cash close — they start from wherever ES and NQ have settled over the previous hour. If futures ran 1.2% higher on a soft CPI print, individual stocks gap higher at the open to match that implied value, and market makers price the opening auction using the futures basis as their reference point. The "gap" retail traders see on their cash index chart at 09:30 isn't a mystery — it's futures having already done the work an hour earlier.
Futures vs cash market reaction to economic data: a worked sequence
- 07:00–08:29 ET — overnight ES/NQ drift as desks position into consensus estimates.
- 08:30:00 ET — data hits, futures order book thins, price gaps or spikes within seconds.
- 08:30–09:30 ET — futures trend or chop in isolation, setting the fair-value gap against yesterday's cash close.
- 09:30 ET — cash opening auction re-prices stocks to meet futures level; the index "gaps" to catch up.
The same sequence plays out in ZN (10-Year Treasury futures) against the cash bond market, and in GC (gold futures) against spot gold — though spot gold already trades close to 24 hours, so the lead is thinner there than it is in equity index futures.
Which economic releases actually move futures — and which are noise?
Four releases dominate the macro calendar: Nonfarm Payrolls (NFP), CPI, Core PCE, and the FOMC rate decision. Everything else — ISM Manufacturing PMI, retail sales, jobless claims — is second-order and only matters when it contradicts the tier-1 narrative already priced into ZN, ES, and NQ.
Tier 1: NFP, CPI, Core PCE and the FOMC decision
Nonfarm Payrolls drops first Friday of the month at 08:30 ET from the Bureau of Labor Statistics, and it's still the single biggest reliable vol event on the futures calendar — any NFP futures trading strategy is built around the fact that this print resets rate-cut odds for weeks. CPI, also BLS, mid-month, same 08:30 ET slot, triggers the sharpest CPI release futures volatility of any data point because it's the Fed's inflation scoreboard in the market's eyes, even though the Fed itself officially prefers Core PCE. Core PCE Price Index, published by the Bureau of Economic Analysis at month-end, carries less headline drama but more credibility with the FOMC — don't dismiss it just because retail traders talk about it less. Then there's the FOMC decision itself: statement and dot plot at 14:00 ET, Powell's press conference at 14:30 ET. FOMC futures trading is a different animal entirely — it's not a surprise-vs-consensus trade, it's a forward-guidance trade, and the second leg (press conference) regularly reverses the first leg (statement).
Tier 2: ISM Manufacturing PMI, retail sales, jobless claims
ISM Manufacturing PMI, weekly jobless claims, and retail sales move futures — but usually only a fraction of a tier-1 print, and mostly when they're wildly off consensus or when they land in a data vacuum between NFP and CPI weeks. Treat them as confirmation data, not catalysts.
| Release | Source | Typical Time (ET) | Tier | Primary Futures Impact |
|---|---|---|---|---|
| Nonfarm Payrolls | BLS | 08:30, 1st Friday | 1 | ZN, SOFR, ES, NQ, DXY, GC |
| CPI | BLS | 08:30, mid-month | 1 | ZN, ES, NQ, GC |
| Core PCE | BEA | 08:30, month-end | 1 | ZN, ES, NQ |
| FOMC Decision | Federal Reserve | 14:00 + 14:30 | 1 | ZN, ES, NQ, DXY, GC |
| ISM Manufacturing PMI | ISM | 10:00, 1st business day | 2 | ES, CL (growth read) |
| Retail Sales | Census Bureau | 08:30, mid-month | 2 | ES, NQ (modest) |
| Jobless Claims | DOL | 08:30, weekly | 2 | ZN, ES (modest) |
Why consensus vs actual matters more than the headline number
ES doesn't care that payrolls printed +180k. It cares that consensus was +120k. The consensus vs actual gap — the surprise, measured against the spread of economist forecasts — is what actually repositions the curve, because the "expected" scenario is already baked into price before the release hits the tape. A +180k print against a +190k consensus is a dovish miss, not a bullish beat, and futures will trade it that way in the first 60 seconds whether or not the headline "looks good" on a financial news ticker.
The reaction chain: rates first, then FX, then equity indices, then commodities
The order matters because it's a rates story first. ZN and SOFR futures move in the opening seconds — that's the market repricing the path of Fed funds. DXY follows as the dollar adjusts to the new rate differential. ES and NQ then price the shift in the discount rate applied to future earnings — and NQ is typically the higher-beta expression of a rates surprise, because the Nasdaq-100's mega-cap, long-duration growth names are more sensitive to discount-rate moves than the broader S&P's value tilt. GC and CL bring up the rear, responding to the dollar move and the growth read embedded in the data. If you're only watching ES, you're watching the last domino fall.
The first 90 seconds: what actually happens to the order book
Resting depth in ES can fall by more than half in the final minutes before a tier-1 print as market makers pull quotes to avoid getting picked off by faster participants — so the same 10-lot that moves price one tick at 08:25 ET can move it six or eight ticks at 08:30:01. Understanding why requires watching the depth of book, not just the chart.
T-5 minutes: liquidity withdrawal and book thinning
Five minutes out from an 08:30 NFP or CPI print, watch the DOM instead of the chart. Visible size at each price level starts shrinking — market makers aren't gone, they're just not showing size they don't want run over. A book that normally shows 300-400 contracts on the best bid and offer in ES can thin to 40-60 by T-1 minute. The spread, usually a single tick, starts flickering to two. This is liquidity gaps forming in real time, and it's completely normal — it's the mechanism, not a malfunction.
T-0 to T+15 seconds: the spike, price banding and Velocity Logic
The number prints, algos read the headline figure before you've finished reading it, and price can move 15-25 ticks in ES in well under a second. This is where CME Group's Velocity Logic and price banding matter. Velocity Logic is CME's circuit-breaker-style mechanism that triggers a brief, automatic pause (typically measured in seconds) when price moves more than a defined amount within a defined interval — it exists specifically to stop exactly this kind of air-pocket move from cascading unchecked. Price bands, separately, define a tradeable range around the last price; orders priced outside the band get rejected rather than filled. Full mechanics are public at cmegroup.com. Practically: "the market gapped" is very often "my order was never filled because it fell outside the band, or it filled against the only size left standing."
T+15s to T+2 minutes: the retracement and the real auction
The initial spike is rarely the real price. Stops clustered just above or below the pre-release range get swept in the first leg — that's the stop-run, and it's mechanical, not malicious. Once that forced flow clears, genuine two-way interest returns: spreads compress back from 6-8 ticks toward 2-3, depth rebuilds, and the 15-second chart starts printing a real range instead of a vertical line. This second phase, roughly T+15s to T+2min, is the actual price discovery — the spike was just inventory clearing.
Why your market order filled eight ticks away
A market order guarantees execution, not price — in a book that's gone from 300 contracts deep to 40, your fill walks through every level in between. That's slippage during news futures in its purest form, and it's effectively a tax for demanding immediacy when ES NQ volatility during news releases peaks.
| Order type | Fill certainty | Price certainty | Typical cost in the spike |
|---|---|---|---|
| Market order | High | Low | 4-8 tick slippage |
| Limit order | Low (may not fill) | High | Zero slippage, missed fill risk |
| Stop-limit | Low (gaps through) | High | No fill if price bands through your limit |
None of these is "safe" — you're choosing which risk you'd rather hold during the window.
How do institutions use index futures around macro events?
Institutions and index futures around macro events do three distinct jobs: hedging existing cash equity exposure, expressing a macro view with minimal friction, and providing — or deliberately withdrawing — liquidity. Understanding which job a desk is doing in a given minute tells you more about the order book than any indicator will.
Hedging an equity book without selling the book
A pension fund or long-only manager holding hundreds of single-stock lines doesn't liquidate positions ahead of CPI. Unwinding a diversified book takes days, costs commissions and market impact on every name, and signals intent to the whole street. Instead, the desk runs a macro overlay: sell E-mini S&P 500 futures (ES) for the notional beta it wants to neutralise, hold the short through the print, then lift the hedge once the number is digested. The cash portfolio never moves. This is why ES volume spikes into 08:30 even though nothing has changed in the underlying stocks — the hedge is temporary, surgical, and reversible within minutes.
Index futures as the cheapest way to express a macro view
If a desk wants to be short equity beta for an hour around FOMC, buying puts on 500 names or shorting an ETF basket is operationally heavy. One ES or E-mini Nasdaq-100 (NQ) ticket does it in a single fill, with no stock borrow to arrange, no uptick restrictions, and margin efficiency through CME Group's portfolio margining — a short futures position nets against other exposures in the same account rather than requiring fully separate collateral. Add nearly 23-hour Globex access and you have the lowest-friction instrument on the exchange for expressing "I think this number moves markets." That's the core reason futures — not cash equities, not options — are the first price to react when the release hits.
Liquidity provision — and liquidity withdrawal
The same desks quoting tight two-tick markets all session are often market makers managing inventory risk, not directional bettors. But market making requires being able to hedge your own book, and nobody wants to be short gamma into a surprise CPI print. So in the final sixty seconds before 08:30, those same desks pull size, widen quotes, or step away entirely. The book doesn't thin because of some external force — it thins because the people who were providing the depth you traded against all morning made a conscious decision to stop.
What the overnight ES range tells you about positioning
Here's the practical takeaway: the overnight range and volume profile on ES into 08:30 is a map of where positioning already sits. A tight overnight range with volume clustered at one level suggests the market is leaning one way and hasn't been tested. A wide range with volume spread evenly suggests two-sided positioning and genuine uncertainty. In both cases, the first impulsive move after the release tends to run toward the edge of that overnight range before it reverses or extends — because that edge is where the next batch of stops and unfilled limit orders is sitting.
Can you trade news on a futures evaluation?
It depends entirely on the firm and the specific programme — never assume. Some futures evaluations let you trade through tier-1 releases with zero restriction. Others require you to be flat for a window around the print, commonly two to five minutes either side of releases like NFP or FOMC. Some will void the trade, or the account, if a position opens inside that window. The rule lives in the programme's terms document, not in a forum thread or a YouTube comment section — read it before the print, not after your account gets flagged.
What prop news-trading rules typically restrict
- Flat-window requirements — no open position during a defined window (e.g., 2 minutes before to 2 minutes after a tier-1 release).
- Reduced-size requirements — you can hold a position, but only below a specified contract count during the news window.
- "No new entries" vs. "no positions at all" — some rulebooks only block fresh entries during the window but allow existing positions to ride through; others require full flat.
- Resting stops — whether a working stop-loss order counts as a "position" for restriction purposes varies by firm, and this detail trips up more traders than any other.
Why firms restrict it: slippage, gaps and trailing drawdown
This isn't arbitrary gatekeeping. On a trailing drawdown, a single slipped fill on an oversized position during a thin-liquidity window can take a simulated account below its threshold in one tick. The firm absorbs that operational consequence — even though the capital is simulated, the evaluation infrastructure, the payout logic and the funded-account math all run on the assumption that drawdown breaches are rare, isolated events, not routine news-driven gaps. Restricting news trading, or sizing it down, is the mechanism that keeps the daily loss limit meaningful instead of something a single NFP spike can blow through in half a second.
How to check the rules before the print — not after
- Read the current programme rulebook section on "restricted trading" or "news trading" — don't rely on onboarding emails or old blog posts.
- Confirm which economic calendar the firm uses to define a "news event" — providers differ on what counts as tier-1 and the exact release timestamp.
- Check whether your daily loss limit resets intraday or is fixed for the full trading day — this changes how much room you have left if a news trade goes against you mid-session.
- Confirm whether resting stop orders count as "positions" under the flat-window rule.
For Traders Futures Challenge: how news sits inside the risk framework
The For Traders Futures Challenge trades CME-listed contracts under a defined daily loss limit and trailing drawdown, all on simulated capital — the structure is a training device for discipline, not a trap. Specific news-trading permissions for trading news on a futures evaluation should always be verified against the current programme terms before you place a trade around NFP, CPI, Core PCE or FOMC, since terms can be updated between challenge cohorts.
| Restriction type | What it means in practice | Why it exists |
|---|---|---|
| Flat window | No open position for X minutes either side of a tier-1 release | Removes slippage exposure during thinnest liquidity |
| Reduced size | Position allowed but capped below normal max contracts | Limits drawdown impact if the print gaps against you |
| No new entries only | Existing positions can ride through, fresh entries blocked | Protects against chasing the initial spike |
| Resting stops count or not | Varies by firm — read the fine print | Determines if a stop-only position is "flat" or "live" |
Ready to trade funded capital?
Choose your path — Instant Accounts, One-Step or Two-Step Challenges — from just $23, with up to $300,000 in funded capital.
Choose your challengeThree news playbooks: flat, second leg, failed-spike fade
There are exactly three defensible ways to trade a tier-1 release in ES, NQ, or any index future — be flat and trade the resolution, join the second leg once the first move has proven itself, or fade a spike that fails to hold. Holding full size through the 08:30 print hoping for the best isn't a strategy; it's a coin flip with slippage bolted on.
Playbook 1: flat into the print, trade the resolution
You're out of the market at 08:29:55. No position, no resting stop that counts as exposure. The data prints, the first 1-minute candle does whatever it does — that candle is noise, not signal. You wait for it to close, then you wait for the next one to confirm direction. Entry trigger is a break of the first candle's high or low in the direction the second candle confirms. Stop goes 1.0–1.5x the 5-minute ATR(14) beyond the entry candle's opposite extreme — not a fixed 8-tick stop, because volatility on an NFP futures trading strategy day at 08:31 is a different animal than the same instrument at 11:00. Realistic R:R here is modest, often 1.5:1, because you're entering after the move has already started. That's the price of not guessing.
Playbook 2: the second-leg continuation entry
This is the one most futures day traders actually run. Let the first 5-minute candle fully close. Mark its high and low — that range is your reference, not a level to trade inside of. Entry trigger is a break and hold beyond that extreme in the direction of the rates move (yields up, ES typically leans down, and vice versa). "Hold" means a 5-minute close beyond the level, not a wick through it. Stop sits beyond the midpoint of that first candle, which in ATR terms usually lands around 0.75–1.0x the 5-minute ATR. If price reclaims the midpoint after you're in, you're wrong — exit, don't average. This is a second leg continuation entry, not a reversal trade, so invalidation is tight by design.
Playbook 3: fading the failed spike
Price extends hard on the print, fails to make a new high (or low) within the following two 5-minute bars, and reclaims the pre-release level. The tell that separates a real fade from a guess: check that ZN (10-year note futures) and DXY didn't confirm the move. If ES spikes but the rates market shrugs, that spike is exhaustion, not information. Entry trigger is the reclaim of the pre-release price. Stop goes just beyond the failed spike's extreme, typically 1.0x ATR, because that high or low is now your clean invalidation level — if price takes it out, the fade thesis is dead. This is a mean-reversion trade against a liquidity-starved extension, and it only works because the first move overran itself.
Entry triggers and ATR-based stops and invalidation for each
- Flat-into-resolution: trigger = break of confirmation candle; stop = 1.0–1.5x 5-min ATR beyond entry bar extreme; invalidation = close back through entry bar.
- Second leg continuation: trigger = 5-min close beyond first candle's high/low; stop = 0.75–1.0x 5-min ATR, placed beyond the candle's midpoint; invalidation = reclaim of midpoint.
- Failed-spike fade: trigger = reclaim of pre-release level after two bars without a new extreme; stop = 1.0x 5-min ATR beyond the spike high/low; invalidation = new extreme taken out, confirmed by ZN or DXY following.
Expressing stops in ATR multiples rather than fixed ticks matters because volatility expansion on news days isn't linear — a 10-tick stop that's reasonable at 08:31 is practically a scratch trade by 11:00 once the range compresses. Whichever playbook you run, risk management on futures news trading comes down to one rule above all: pick one setup, write the entry, stop, and invalidation down before 08:30, and trade only that plan. Improvising at 08:30:03 is how evaluations end.
How do you size a news trade with a trailing drawdown live?
Size the trade off your worst realistic fill, not your intended entry. Before you place anything, assume a few ticks of adverse slippage on both the entry and the stop, then solve backwards for how many contracts you can hold against what's actually left of your daily loss limit — not your account's full stated limit, but the buffer you have today.
Micro contracts (MES, MNQ, MGC) as the risk valve
This is exactly why micro futures for news events exist. MES, MNQ, and MGC let you dial size in small enough increments that your worst-case slippage scenario still fits inside a tight daily loss limit. Full-size ES or NQ often can't — the tick value alone eats most of your remaining buffer in one contract, leaving you with an all-or-nothing position right when you need the most control. If your trailing drawdown is close to the high-water mark, one micro contract — sometimes even a fractional mix across MES and MNQ — is the mathematically correct answer, not the "beginner" option.
A worked example: max contracts against a daily loss limit
Say you've got $300 left before you hit your daily loss limit. Your plan calls for a 10-tick stop, but around a release you budget 2 ticks of entry slippage and 3 ticks of stop slippage — 15 ticks of real risk per contract, worst case.
| Contract | Tick value | Worst-case risk (15 ticks) | Max contracts ($300 buffer) |
|---|---|---|---|
| MES | $1.25 | $18.75 | 16 |
| MNQ | $0.50 | $7.50 | 40 |
| ES | $12.50 | $187.50 | 1 |
| NQ | $5.00 | $75.00 | 4 |
One ES contract burns $187.50 of your $300 buffer on paper — no room left if the fill runs even a tick worse than modeled. The MES version of the same trade leaves slack for a second attempt, or for a stop that gets hit a few ticks beyond plan without ending your day.
Budgeting for slippage before you place the order
Position sizing futures around news isn't about your edge — it's about not being wrong about your own risk. Slippage during news futures trading isn't symmetric either: your stop tends to fill worse than your entry because liquidity thins exactly when price is moving fastest. Build that asymmetry into the ticks you budget, not just an average spread number from a calm Tuesday morning.
The trailing drawdown trap compounds this. On a trailing drawdown rule, unrealized profit can lift your threshold in real time — a sharp move in your favor pushes your equity curve up, and the drawdown floor trails up with it. If price then reverses before you've locked anything in, you can get stopped out below the new high-water mark without your P&L ever showing a realized loss. The account still gets flagged. News-day volatility is exactly when this happens most, because the swing that triggers it is often just the release's first leg before the real move.
The pre-release risk checklist
- Cut size to 25–50% of normal at least 10 minutes before the release (by 08:20 ET for an 08:30 print).
- Widen stops to at least 1.5× the 5-minute ATR, or stand aside entirely if that stop no longer fits your risk management futures news trading plan.
- Cancel all resting limit orders sitting inside the expected post-release range — they will get run over, not filled at your price.
- Confirm current margin requirements before you size up; CME and clearing firms frequently raise intraday margin around FOMC, NFP, and CPI.
- Set a hard daily stop before 08:30 — one bad print, you're done for the day, no exceptions.
Reading economic shifts between releases: what futures tell you
Futures markets price the next macro surprise before it happens — you don't need to wait for the next print to know what's already baked in. The SOFR and fed funds strip, read through CME FedWatch, assigns a live probability to every rate outcome at every upcoming FOMC meeting, and that probability shifts every session, sometimes every hour. Treat it as a running forecast, not a static number you check once a month.
The rate futures curve as a running forecast
The fed funds futures curve is the market's collective bet on where rates land at each meeting, months out. When a dovish CPI print lands and the curve barely moves, that's not the market ignoring the data — it's the market telling you it already priced the cut weeks ago. This is exactly why you get "good news, no reaction" days that confuse traders watching only the headline number.
CME FedWatch and implied rate-cut probabilities
Before any CPI, NFP, or Core PCE release, pull up FedWatch and note the implied odds for the next meeting. If the tool already shows an 85% probability of a cut, a soft inflation print has almost no room left to push ES higher — the move was already spent. The real tradeable surprise is when the print forces a repricing of probabilities the market hadn't considered, not when it simply confirms consensus. That's your edge: measuring the gap between what's priced and what prints, not the print in isolation.
Copper, crude and gold as growth and inflation proxies
10-Year Treasury Note futures (ZN) give you the cleanest read on the long end — watch it react to CPI before equities even open, since ZN trades the inflation and growth outlook directly without an earnings layer in the way. US Dollar Index (DXY) futures carry the dollar leg of every macro surprise. Copper and crude oil futures (CL) function as growth proxies — copper especially, since it has no OPEC supply story clouding the demand signal. If copper and CL are both grinding higher into a jobs report, the market is leaning into a growth-strength narrative, and a hot NFP print has less shock value than the headline suggests.
Gold futures (GC/MGC) and the safe-haven reaction
Gold futures (GC/MGC) are a pure rates-and-dollar trade with zero earnings component, which is exactly why gold frequently front-runs the equity reaction on inflation surprises — it moves on real yields and DXY alone, with nothing else to digest. Watch GC in the first 60 seconds after CPI or FOMC; it often tells you which direction the "real" surprise runs before ES commits. This is also why gold sits as the single most-traded instrument on the For Traders platform — traders use Micro Gold futures (MGC) to express a macro-print view at a fraction of the notional of a full GC contract, which matters when you're sizing into an event where the book has already thinned. Futures aren't just a venue to trade the news — read across ZN, DXY, CL, and gold together, and they're a leading indicator of where the economic narrative is actually heading, well before the next scheduled release confirms it.
Ready to trade funded capital?
Choose your path — Instant Accounts, One-Step or Two-Step Challenges — from just $23, with up to $300,000 in funded capital.
Choose your challengeWhich economic calendar and data sources do futures traders use?
Serious futures traders don't rely on a third-party calendar app as their primary source — they work from the actual release schedules published by the agencies that generate the data, then layer a consensus-carrying economic calendar for futures traders on top for the forecast and prior figures. That order matters: the primary source tells you what happened, the calendar tells you what the market expected.
Primary sources: BLS, BEA and the Federal Reserve
The Bureau of Labor Statistics publishes the Non-Farm Payrolls and CPI release calendar a year in advance, down to the exact 08:30 ET print time. The Bureau of Economic Analysis does the same for GDP and Core PCE — the Fed's preferred inflation gauge, which often moves ZN and gold more than headline CPI does. For the event that reprices every curve on the board, go straight to the Federal Reserve's published FOMC calendar, which lists meeting dates, statement times, and press conference schedules months ahead. Bookmarking these three sources directly cuts out the lag and rounding errors you get from aggregator sites.
CME Group for contract specs, margins and trading halts
CME Group is your source of record for anything mechanical around the contract itself — margin requirements, which frequently step up ahead of FOMC and NFP, trading halt rules if a circuit breaker trips on an ES or NQ move, and contract roll dates. None of that lives on an economic calendar, and all of it can change the math on a position you're already holding into a release.
Setting up an intraday calendar that shows consensus and revisions
Configure your calendar to filter US high-impact only — you don't need Australian retail sales cluttering your 08:30 ET window. Display consensus and prior next to actual, not just the headline print, and flag revisions. A strong NFP headline with a large downward revision to the prior two months is a materially different trade than a clean beat, even though the top-line number looks identical on a push notification.
Rehearsing news execution on simulated capital
Timing matters as much as the source list. The London/New York overlap, roughly 08:00–12:00 ET, is the deepest liquidity window of the trading day — which is exactly why 08:30 ET releases produce such violent repricing instead of a slow drift. The only way to learn how your execution actually behaves in that window without paying tuition in slippage is to rehearse it on simulated capital first. A For Traders Futures Challenge forces that discipline through its drawdown rules — you find out whether your news-trading plan survives before a single dollar of real risk is on the line.
Trading the print vs standing aside: an honest scorecard
Pros
- Scheduled releases are the only moments of the day where volatility expansion is known in advance — you can prepare for them
- Tier-1 prints often set the day's directional bias, so the post-release trend day can offer high R:R well after the spike
- Futures trade at 08:30 ET while the cash market is closed, giving a clean, uncontaminated read on the macro reaction
- Micro contracts let you participate with a fraction of the notional, so the lesson costs far less than it used to
- News days reward the one skill evaluations actually test: pre-defined risk executed without improvisation
Cons / risks
- Slippage in the first 15 seconds can exceed your planned stop distance entirely, turning a 1R risk into 3R
- Trailing drawdown rules punish round trips — a spike in your favour can lift the threshold before price reverses through it
- Many prop evaluations restrict or prohibit entries around tier-1 releases, and breaching the rule can void the account
- The first move is wrong often enough that fading and chasing both fail regularly for the same trader in the same week
- Price banding and momentary halts mean your order may simply be rejected at the moment you most want the fill
Frequently Asked Questions
How do economic data releases show up in index futures before the cash market reacts?+
Index futures reprice within milliseconds of a release because they trade nearly 24 hours and carry the deepest liquidity pool outside the cash open. By the time the NYSE opens, futures have already absorbed the first and often second leg of the reaction, which is why the cash index frequently gaps to meet the futures price rather than discover it fresh. Futures traders effectively see the market's verdict on NFP or CPI minutes before equity-only traders get a tradable print. That lead time is the core reason futures are the benchmark for pre-market sentiment.
Can you trade news on a futures evaluation?+
Most futures prop firms allow news trading but restrict it around specific "high-impact" windows, commonly a few minutes before and after releases like NFP, CPI, or FOMC. For Traders' challenge rules specify which windows apply and whether violations void a payout rather than the account itself — always check the current rule sheet before trading a print. The restriction exists because spreads widen and fills get unreliable right at the release, which can produce violations that aren't really about your trading skill. Build your plan around the exact window stated in your challenge terms.
How do institutions use index futures around macro events?+
Institutions use index futures mainly for hedging and liquidity provision rather than speculation on the headline number itself. A portfolio manager holding a large equity book will sell futures ahead of CPI to hedge overnight gap risk without touching the underlying basket, then unwind the hedge once volatility settles. Market makers also widen and narrow quoted depth in futures as a release approaches, which is why you see liquidity evaporate right before 8:30 ET and refill seconds after. This institutional flow — not retail positioning — drives most of the initial spike.
How can market watchers use futures to track broader economic shifts?+
Futures prices act as a running referendum on economic expectations because they trade continuously and react to every data point in real time. Watching how S&P or Nasdaq futures respond to a string of releases — not just one print — tells you whether the market is repricing growth, inflation, or rate-path expectations over weeks, not just reacting to a single headline. Rates futures (like Fed funds futures) are especially useful for this since they directly price policy expectations. Treat futures less as a trade signal and more as a live sentiment gauge between data releases.
Which economic releases move futures the most?+
Nonfarm payrolls, CPI, and FOMC rate decisions consistently produce the largest futures moves because they directly shift rate-path expectations. PCE inflation and ISM manufacturing data rank next, with reactions depending heavily on how far the actual print deviates from consensus. Second-tier data — retail sales, housing starts, regional Fed surveys — usually causes noise rather than trend, unless it surprises sharply. The size of the surprise relative to consensus matters more than the data category itself, so always check the expected number before assuming a release is worth trading.
Why does the gap between consensus and actual matter more than the headline number?+
Futures prices already reflect the consensus estimate before the release, so the market moves on the surprise — actual minus expected — not the absolute figure. A payrolls print of 250,000 can spike futures sharply higher or lower depending on whether consensus was 180,000 or 280,000. This is why experienced futures traders check the expected number on their calendar before the print, not just the result afterward. Trading the headline without knowing consensus is a common mistake that leads to fading a move that's actually continuing in the surprise's direction.
What happens to futures spreads and slippage around a news release?+
Bid-ask spreads on index futures can widen several ticks in the seconds before and after a major release as market makers pull resting orders to avoid being picked off. Depth of book thins out, so even modest-sized orders can slip multiple ticks from the quoted price, and stop orders placed near round numbers often get filled at worse levels than expected. This window typically normalizes within 30-90 seconds as liquidity providers step back in. Many futures traders deliberately avoid market orders in this window and wait for spreads to compress before entering.
How do you practise news execution before risking a funded evaluation?+
Replay historical data releases on simulated capital, matching the exact time stamp of past NFP or CPI prints to a demo chart, and practise your entry and stop placement without real consequences. For Traders' Challenge accounts run on simulated capital from day one, so you can test a news-trading plan under the same spread and execution conditions you'll face live without burning an evaluation attempt. Track your fills against the actual historical spread widening, not a clean backtest, since real slippage during news is the variable most traders underestimate.
Written by
Marcel Hambálek
Senior Trader, For Traders
Marcel trades Futures and Forex day-trading setups on funded accounts and writes about the executional details most traders skip — order types, slippage, session timing, platform quirks on MT5 and NinjaTrader. Pragmatic, mechanics-first, no fluff.
Follow on LinkedInReady to trade funded capital?
Choose your path — Instant Accounts, One-Step or Two-Step Challenges — from just $49, with up to $300,000 in funded capital.
Choose your challengeTrade up to $300,000
Choose challenge