
A trading journal is more than just a list of your trades - it's a tool to help you improve as a trader. By documenting your trade setups, risk management, and emotions, you can identify patterns, correct mistakes, and refine your strategies. Regular reviews (daily, weekly, monthly) are key to spotting trends and making better decisions. Whether you use a manual or automated system, the goal is to track your performance metrics, learn from your data, and stay disciplined. Tools like TradesViz or resources from platforms like For Traders can streamline this process, helping you focus on what works and avoid what doesn't. Start journaling today to take your trading to the next level.
How I Journal Every Single Trade (Step-by-Step Process)
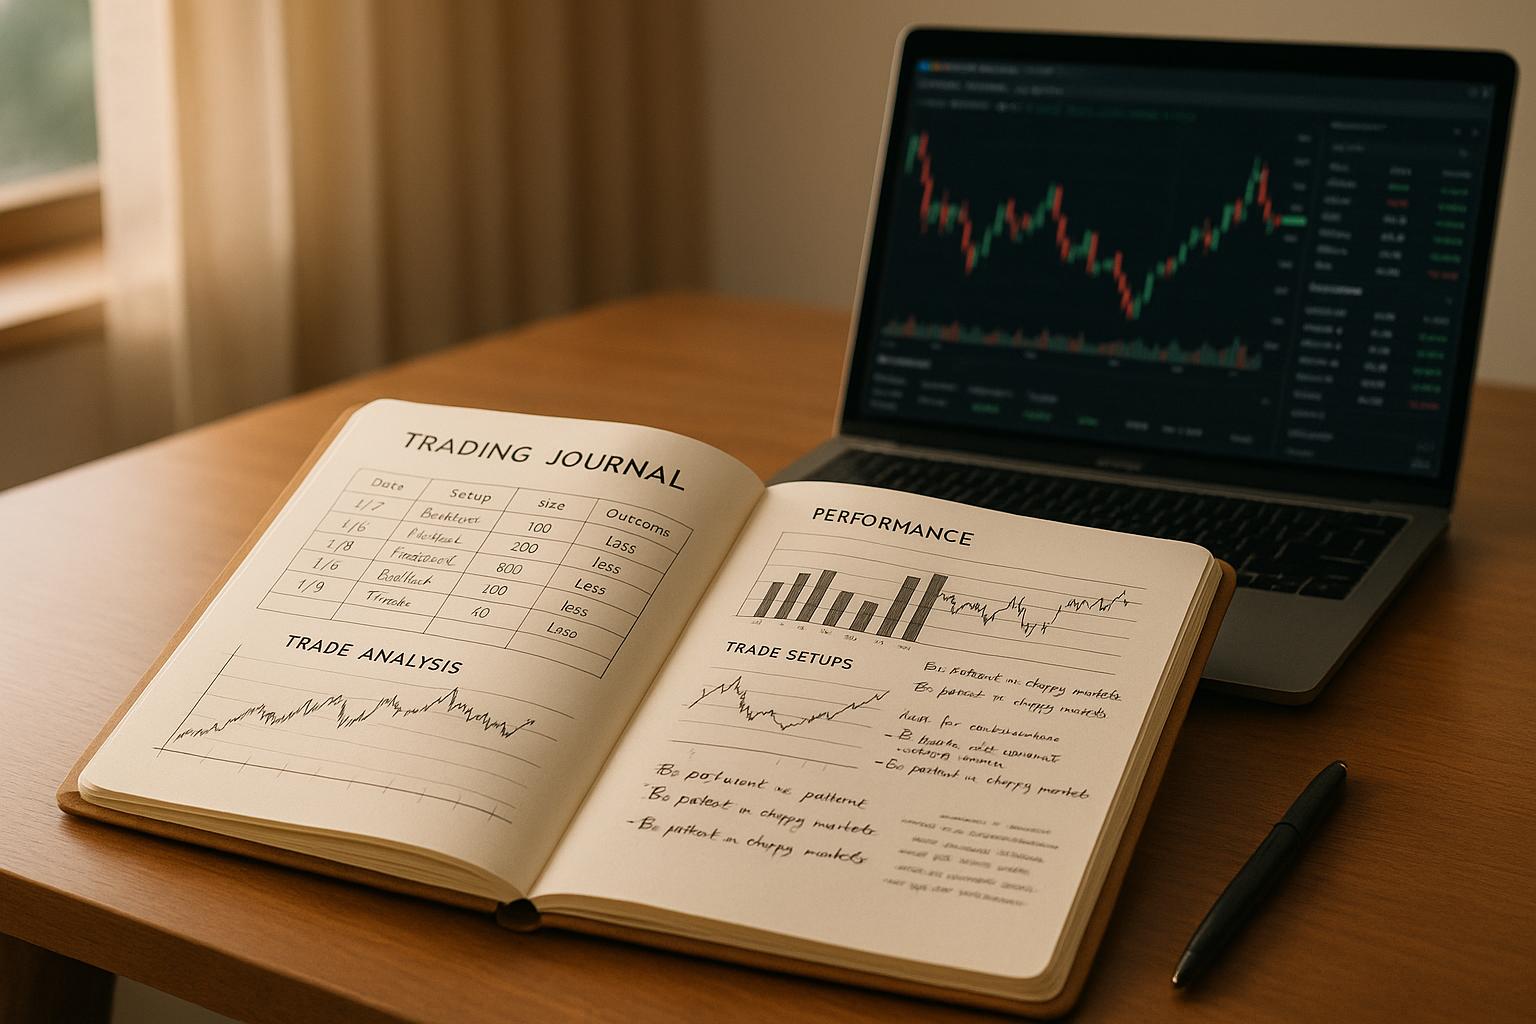
Key Parts of a Trading Journal
A well-maintained trading journal is essential for self-evaluation in simulated prop trading. Its core elements - trade setups, risk management, and emotional triggers - offer a comprehensive view of your trading habits. Together, they help uncover patterns and provide actionable insights for future improvement.
Trade Setups and Reasons
Recording your trade setups and the reasoning behind them is crucial for assessing the effectiveness of your strategies. Each trade entry should include key details like the date and time, the instrument traded, entry and exit points, and the rationale for taking the trade.
Your rationale might stem from technical indicators, fundamental analysis, market news, or even intuition. For instance, you could write: "Bought AAPL at $150.25 on 08/07/2025 at 10:30 AM after a bullish breakout above $150 resistance, confirmed by RSI at 65." Including details such as support and resistance levels, chart patterns, and overall market sentiment adds depth to your analysis. Over time, consistent documentation can reveal trends in what works and what doesn’t, helping you refine your approach.
Risk Management and Position Sizing
Tracking risk management practices is another essential aspect of your journal. This includes noting your position size, stop-loss levels, and the risk-to-reward ratio for each trade. For example, if you’re managing a $100,000 account and risking 1% per trade, you’d record a $1,000 risk. You might log an entry at $50.00, a stop-loss at $49.00, and a target at $52.00, reflecting a 1:2 risk-reward ratio.
Diligently documenting these details helps you determine whether you’re sticking to your plan or letting emotions steer your decisions. While risk management protects your capital, combining it with emotional tracking can uncover underlying factors impacting your performance.
Emotional and Mental Triggers
Your trading journal should also track your emotional state before, during, and after each trade. Logging emotions - like anxiety, confidence, or frustration - on a 1–10 scale can provide valuable insights. Physical cues, such as increased heart rate, sweating, or tension, should also be noted. For example, you might write: "Felt anxious (7/10) before entering the trade due to a recent loss. Noticed tight shoulders and a rapid heartbeat."
Finding Patterns and Getting Insights
Once you've logged detailed trade setups, risk management practices, and emotional notes, the next step is to analyze that data. This process helps uncover patterns that can sharpen your trade selection and risk management - two critical elements for improving your overall trading performance.
Identifying Repeated Mistakes and Wins
Take a close look at your winning trades to identify common setups that consistently lead to success. At the same time, review your losses to spot recurring mistakes. For instance, you might notice that breakout trades perform better when market conditions align, or you could discover that overtrading - taking too many trades in a single day - leads to lower win rates.
Recurring mistakes often become visible only when you step back and review your trades over time. Overtrading, for example, might stand out when you notice a pattern of making extra trades on certain days, which frequently end in losses.
"Recognize frequent mistakes to correct detrimental behaviors".
To make this process easier, tag your journal entries with specific keywords like "breakout trade" or "revenge trade." This categorization allows you to quickly compare successful trades with less successful ones by analyzing factors like the time of day, position sizing, or market volatility when the trades were executed.
Leveraging Charts and Data Tools
Sometimes, patterns aren’t immediately obvious when you're just looking at individual journal entries. That’s where spreadsheets and data tools come in. Using tools like Excel, you can create pivot tables and charts to visualize performance data. For example, you could chart success rates by time of day, average returns by trade type, or win/loss ratios under different market conditions.
If you're looking for more detailed insights, specialized trading platforms can take your analysis to the next level. These platforms often include advanced analytics that can transform raw data into actionable insights. Some even offer AI-powered tools that answer questions like, "What are my worst-performing days?" or "Which setups have the lowest win rates?"
Whether you stick with Excel or invest in a dedicated platform, focus on creating visual representations of your key metrics. Charts showing trends in monthly profits, risk management effectiveness, or emotional triggers can uncover correlations that might otherwise go unnoticed. These visual aids are invaluable for structured performance reviews and help you make data-driven decisions.
Daily, Weekly, and Monthly Reviews
Setting up a consistent review schedule is crucial for continuous improvement. Each review period - daily, weekly, and monthly - serves a unique purpose.
- Daily reviews: Spend 10–15 minutes at the end of each day reviewing your trades. This quick feedback loop helps you evaluate execution quality and identify emotional influences that may have impacted your decisions. Catching bad habits early prevents them from becoming ingrained.
- Weekly reviews: Take a broader look at your trades from the past week. This helps you identify patterns tied to market conditions or specific days where your performance stood out - either positively or negatively.
- Monthly reviews: Dive deep into your trading stats at the end of each month. Compare your current performance with previous months to identify long-term trends. Calculate metrics like your average risk-reward ratio, win rate by setup type, and maximum consecutive losses. Pay attention to any shifts in emotional patterns and evaluate whether your risk management strategies are improving your results.
"Regular review helps identify trends, adjust strategies, and maintain trading discipline".
Tools and Features for Journal Management
The right tools can turn a simple trading log into a powerful tool for improving performance. Whether you prefer manual tracking or automated solutions, choosing the right system can make a big difference in how effectively you track and analyze your trades.
Manual vs. Automated Journaling
Both manual and automated journaling methods have their strengths, and the choice depends on your goals and how much time you’re willing to spend on data entry versus analysis.
Manual journaling gives you full control over what you record. This method allows you to document detailed observations about market behavior, your emotional state, and personal insights - things that automated systems may overlook. However, it can be time-consuming, often requiring 3–5 hours each week for thorough data entry and review.
On the other hand, automated journaling tools like TradesViz streamline the process significantly. These platforms automatically sync trade data from brokers, saving traders 2–3 hours per week on average. TradesViz, for example, is used by over 100,000 traders and processes more than 50 million trades worldwide. It offers advanced analytics, including over 600 statistics and AI-powered insights, to help traders identify patterns and improve their strategies.
Here’s a quick comparison:
| Feature | Manual Journaling | Automated Journaling |
|---|---|---|
| Data Entry | Requires manual input | Auto-syncs from brokers, with instant updates |
| Analysis Depth | Limited to basic calculations | Includes 600+ statistics and AI analytics |
| Customization | Flexible note-taking and categories | Custom dashboards and widgets |
| Time Investment | 3–5 hours weekly | Around 30 minutes weekly |
| Emotional Tracking | Highly detailed | Can integrate with psychological tools |
| Cost | Free (spreadsheets) to low-cost | $0–$29/month for advanced features |
The best approach often combines both methods. Automated tools handle the heavy lifting - like importing trade data and generating metrics - while manual journaling allows you to add personal insights, emotional reflections, and market observations.
Once you’ve decided on your journaling method, you can further refine your process with resources designed specifically for traders.
Templates and Resources from For Traders
For Traders offers tools and templates that make maintaining a trading journal easier and more effective, especially for those participating in simulated trading challenges. Research shows that tracking performance can improve trade accuracy by 15–20%, which is critical for meeting challenge goals and earning profit shares.
The platform provides 12+ video courses that teach journaling best practices alongside trading strategies. These courses focus on tracking metrics that align with challenge requirements, such as adhering to a 5% maximum drawdown and achieving a 9% profit target. Additionally, For Traders’ integrated dashboards automatically monitor key metrics like daily and overall drawdowns, which can help reduce maximum drawdown by 25–30%.
For Traders also fosters a sense of community through its Discord group, where traders share journaling templates, discuss analysis techniques, and provide feedback. This collaborative environment allows you to refine your journaling approach by learning from others who have successfully completed similar challenges.
"I wish I had TradesViz when I started to trade ten years ago. I had to learn the hard way. It provides everything you need to maximize your wins and minimize your losses." - Jason Freeman, Founder of ChartLearning.com
If you want to expand beyond For Traders' built-in tools, external platforms like TradesViz offer additional features. TradesViz provides five times more features than many competitors while keeping costs lower, starting with free basic plans and scaling up to $29/month for advanced options like unlimited custom dashboards and trading simulations.
Using Journal Insights to Improve Simulated Trading
Once you've maintained clear journal records and identified patterns in your trading, the next step is putting those insights to work. Your journal can shed light on which trade setups tend to succeed and which ones fall short, helping you make targeted adjustments that improve your performance in simulated prop trading environments.
Improving Trade Selection and Risk Management
Your journal isn't just a record; it's a tool for refining how you pick trades and manage risk. By analyzing your entries, you can pinpoint patterns that consistently lead to successful trades and avoid setups that tend to fail.
For example, review your profitable trades to identify common threads - specific entry signals, favorable market conditions, or even the time of day when you perform best. If your data shows that trades during high-volatility conditions often result in losses, it might be wise to steer clear of such setups in future simulations.
Risk management is another area where journal insights can drive improvement. Patterns like frequent stop-loss hits, over-leveraging, or inconsistent position sizes often emerge during analysis. If you notice that risking more than 1% of your simulated capital on a single trade leads to significant drawdowns, you can adjust your risk tolerance accordingly.
Position sizing is especially critical. Many traders discover that their most successful trades involve smaller positions, while their largest losses stem from oversized ones. Use this data to create firm rules for position sizing that align with your account size and risk appetite.
Your journal might also uncover timing trends. Do you perform better during certain trading sessions or struggle on specific days? For instance, if your analysis shows that you frequently deviate from your trading plan on Fridays, you can implement stricter guidelines or even take the day off trading.
Meeting For Traders Challenge Rules
Simulated prop trading challenges, like those from For Traders, come with strict requirements: achieving a 9% profit target, limiting drawdowns to 5%, and maintaining consistent trading activity. Your journal can help you set realistic profit goals and manage risk to stay within these constraints.
Managing drawdowns is particularly important with a 5% limit. If your journal reveals that large losses often follow losing streaks, you might establish a rule to pause trading after two consecutive losses. This simple adjustment can prevent unnecessary challenge failures.
Take the example of a proprietary trading journal report from FXC Academy in January 2025. It tracked a trader's performance by asset class, showing gold as the most traded pair. The trader achieved a 55% win rate, meeting the criteria to advance in a simulated prop challenge. Personalized feedback from the report, combined with monthly coaching, helped the trader refine their approach further.
Your journal can also help you balance trading frequency. While meeting minimum activity requirements is essential, overtrading can be just as harmful. Analysis might reveal that focusing on fewer, high-quality trades yields better results than taking frequent, smaller positions.
Staying Disciplined and Accountable
Regularly reviewing your journal not only helps meet challenge requirements but also strengthens your overall trading discipline. These reviews create a feedback loop, reinforcing good habits while catching negative patterns early.
Daily reviews are ideal for making quick adjustments. Did you stick to your trading plan? Were there emotional factors influencing your decisions?
Weekly and monthly reviews allow for a deeper dive. Identify recurring mistakes like entering trades without proper confirmation, overtrading after losses, or ignoring risk management rules. On the flip side, highlight what’s working - whether it’s following pre-defined setups, maintaining daily routines, or exiting trades according to plan.
The For Traders Discord community offers another layer of accountability. By sharing journal insights, receiving peer feedback, and learning from others’ experiences, you can stay motivated and gain fresh perspectives on recurring issues.
Finally, use your journal for scenario analysis. Test how adjustments - like tighter stop-losses or different position sizes - might have influenced past trades. This "what if" approach not only prepares you for future challenges but also builds confidence in your strategy.
Consistency is the key. Your journal should document both wins and losses in detail, focusing on the process rather than just the results. The ultimate goal is to create a reliable, systematic approach that aligns with the demands of simulated prop trading challenges.
Conclusion: Using Your Trading Journal for Ongoing Growth
A trading journal isn't just a record of your trades - it's a tool for growth. By consistently documenting, analyzing, and acting on the patterns it reveals, you can refine your strategies and decision-making over time. The goal isn't just to track your performance but to learn from every trade, whether it results in a win or a loss.
Successful traders know that markets are always evolving, and a journal helps them stay ahead by revealing trends and insights from their trading history. For instance, if your journal shows that trades during the first two hours of the New York session have a 70% success rate, while afternoon trades drop to a 30% success rate, you can adjust your schedule to focus on the most profitable times. This kind of data-driven adjustment is key to improving your results over the long haul.
The real power of a journal lies in regular review. Setting aside time each week to analyze your records allows you to spot patterns, identify common trading mistakes, and refine strategies that work. This habit creates a feedback loop that drives continuous improvement. And when combined with the right tools and a supportive community, these insights become even more actionable.
Platforms like For Traders can enhance this process by offering resources that complement your journal analysis. Their video courses, e-books, and active Discord community provide educational support and accountability, helping you understand the factors driving your trading outcomes. Engaging with a community of like-minded traders also allows you to share insights and learn from others' experiences.
Journaling isn't just about tracking trades - it’s about building self-awareness and sharpening your skills. Whether you're aiming to hit a 9% profit target in a For Traders challenge or simply striving for better performance overall, your journal gives you the objective data needed to make smarter adjustments to your trading approach.
As highlighted throughout this guide, success in trading comes from disciplined analysis and the willingness to adapt. There’s no single perfect strategy, but by consistently learning and improving, your journal becomes the roadmap that transforms every trade into a step forward.
FAQs
How can I use a trading journal to track and understand my emotions during trades?
To get a better handle on your emotions during trades, make it a habit to jot down your feelings at three key moments: before, during, and after each trade. You can keep it simple by using a rating scale (like 1 to 5) or labeling specific emotions - think anxiety, confidence, or frustration. Over time, this practice can help you uncover patterns and pinpoint emotional triggers.
To take it a step further, consider adding tools like emotional scorecards or daily summaries to your trading journal. These can help you track trends and understand how your emotions might be steering your decisions. By staying consistent and taking the time to reflect, you'll build greater emotional awareness and make more balanced trading choices.
What are the benefits of using automated trading journal tools instead of tracking trades manually?
Automated trading journal tools bring a lot to the table compared to tracking trades manually. For starters, they save you time by automatically recording your trades, cutting out the need for tedious data entry. Plus, they minimize the risk of errors and keep your records neatly organized, making it easier to analyze your performance.
What’s more, these tools often come with powerful features like performance tracking, pattern recognition, and backtesting. These are tasks that can be incredibly time-consuming and tricky to handle on your own. By simplifying the journaling process, these tools allow traders to spend less time on administrative work and more time refining their strategies and making smarter decisions.
How can reviewing patterns in my trading journal improve my trading strategies?
Reviewing patterns in your trading journal can play a key role in refining your strategies. It helps you uncover recurring trends in both market behavior and your personal decision-making process. By taking a closer look at trade setups, risk management tactics, and emotional responses, you can figure out what’s working and what needs improvement.
For instance, identifying consistent price patterns can help you make smarter decisions about when to enter or exit trades. On the flip side, noticing emotional habits - like overtrading after a loss - can push you to build better self-discipline. This kind of analysis can lead to sharper stop-loss placements, more practical profit targets, and, over time, steadier and more reliable trading results.
Related Blog Posts
Start Trading with For Traders
Join our platform to test your trading skills, trade virtual capital, and earn real profits. Access educational resources, advanced tools, and a supportive community to enhance your trading journey.
Start your Trading Challenge