
Backtesting is essential for improving trading strategies without risking your money. Here's why it matters and how to do it:
- What is Backtesting?: It’s testing a trading strategy on historical data to see how it would have performed.
- Why it Matters: Backtesting helps refine strategies, understand risks, and boost confidence before live trading.
- Steps to Start:
- Define clear rules (entry, exit, stop-loss, etc.).
- Use reliable historical data.
- Choose manual or automated testing based on your strategy.
- Analyze Results: Focus on metrics like net profit, win rate, drawdowns, and Sharpe ratio.
- Common Mistakes to Avoid: Overfitting strategies to past data and ignoring costs like slippage and commissions.
- Tools to Use: Platforms like DXTrade, TradeLocker, or cTrader simplify backtesting and provide realistic results.
Backtesting helps traders turn ideas into data-driven strategies that are more likely to succeed in live markets. Start testing, analyze results, and refine your approach for better trading outcomes.
How To Backtest Trading Strategies Like A Pro: Step-By-Step Guide 100% Free (1/7) | Quantreo

Steps for Effective Backtesting
Backtesting is all about turning trading ideas into clear, testable rules. The better you execute each step in the process, the more reliable your results will be. A solid backtest mirrors real market conditions, helping you refine strategies before putting money on the line.
Define Your Strategy with Clear Rules
Every backtest starts with a well-documented strategy. Vague or loosely defined rules lead to unreliable outcomes, so precision is key. Write down every detail of your trading plan and use a checklist to ensure nothing is left open to interpretation.
Here are the five key components to define:
- Setup Criteria
- Entry Rules
- Stop-Loss
- Take-Profit
- Trade Filters
For example, consider an EMA (Exponential Moving Average) trend-following strategy for SPY:
- Setup Criteria: SPY’s price must close above the 50 EMA on the 4-hour chart, with the volume on the entry candle exceeding the 50-period average.
- Entry Rules: Go long with 100 shares when the price crosses and confirms above the 50 EMA. Go short with 100 shares when it crosses below under similar conditions.
- Stop-Loss: Set a stop-loss at 3 points.
- Take-Profit: Target a 5-point gain, maintaining a 1.67:1 risk-reward ratio.
- Trade Filters: Ensure the 200 EMA on the daily chart confirms an uptrend.
If your strategy involves any discretionary decisions, make sure to include clear guidelines to maintain consistency.
Select Reliable Historical Data
Once your strategy is defined, the next step is to gather high-quality historical data. The accuracy of your backtest depends heavily on the quality of this data. Errors, missing values, or inconsistencies can distort your results, so it’s critical to use clean and reliable datasets.
Your data should cover various market conditions - bull, bear, and sideways - to thoroughly test your strategy's resilience. Preprocess the data by addressing missing values, removing outliers, and adjusting for events like stock splits and dividends. Standardize everything, especially if you’re working across different time zones.
To avoid survivorship bias, make sure your dataset includes companies that went bankrupt, were acquired, or liquidated. This ensures your backtest reflects real-world scenarios.
Choose Between Manual and Automated Backtesting
Deciding whether to backtest manually or automate the process depends on your strategy’s complexity, your technical skills, and your personal preferences.
- Manual Backtesting: This approach works well for simpler strategies. You manually simulate trades on historical charts based on your predefined rules. It’s a hands-on way to identify flaws and validate the logic behind your strategy.
- Automated Backtesting: For more complex strategies, automation is often the better choice. Using software, you can quickly test multiple parameters and scenarios. This method is particularly useful for strategies involving custom indicators or algorithms.
Select a backtesting platform that matches your needs and technical expertise. For advanced strategies, programming tools like Python, along with libraries such as Pandas and Backtrader, offer the flexibility to handle intricate setups. Whether manual or automated, a systematic approach to backtesting lays the groundwork for developing strategies that can withstand market challenges.
How to Analyze Backtesting Results
Once you've completed your backtest, the raw results need a closer look. Diving into key metrics can help you understand whether your strategy has real potential or if it simply benefited from favorable historical data.
Key Metrics to Evaluate Strategy Performance
To truly gauge your strategy's performance, you need to consider a range of metrics. Each one offers a unique perspective on how your strategy behaves under different conditions. Combining these metrics provides a more complete picture of its strengths and weaknesses.
Start with basic metrics. Net profit or loss shows your overall performance, but it’s just the beginning. Your win rate, the percentage of successful trades, needs context. For instance, a strategy with a 40% win rate can outperform one with a 70% win rate if it captures larger profits on its winning trades. Metrics like average win versus average loss show whether your profits are enough to cover your losses. Meanwhile, maximum drawdown highlights the largest decline from a peak, giving you insight into the risk your strategy carries.
The reward-to-risk ratio is another key indicator. It compares your average profit to your average loss. Even with a 60% win rate, a 1:2 risk-to-reward ratio can lead to consistent profitability.
For a deeper dive, turn to advanced metrics. The Sharpe ratio measures returns relative to risk, with higher values indicating better performance. Anything above 1.0 is generally considered strong, while negative values suggest your strategy might not be worth pursuing. The Sortino ratio refines this by focusing only on downside volatility, ignoring price movements that don’t pose real risks.
Consistency matters too. Standard deviation measures the variability of your returns. A lower standard deviation indicates steadier performance, which is often more appealing than volatile results, even if the average return is the same.
Here’s a quick reference for some key metrics:
| Metric | Description | Target Range | Warning Signs |
|---|---|---|---|
| Net Profit/Loss | Overall profit or loss generated | Positive | Consistent losses |
| Win Rate | Percentage of winning trades | > 50% (context matters) | Extremely high or low without further analysis |
| Maximum Drawdown | Largest peak-to-trough decline | < 20% (risk tolerance dependent) | Exceeds your risk tolerance |
| Sharpe Ratio | Risk-adjusted return | > 1 | Below 1, especially negative values |
| Profit Factor | Gross profit divided by gross loss | > 1.5 | Below 1 |
Expectancy is another critical metric, showing the average amount you expect to win or lose per trade. Combine this with the profit factor, which divides gross profits by gross losses. A profit factor above 1.5 often signals a strategy worth considering.
The number of trades also matters. A strategy with 500 trades over two years is more statistically reliable than one with only 20 trades. However, keep in mind that high-frequency strategies can incur significant transaction costs.
Using Tables and Charts for Analysis
Numbers tell part of the story, but visual tools like charts and tables help bring those numbers to life. They can reveal trends and patterns that might otherwise go unnoticed.
Start with your equity curve, a chart of your account balance over time. A good equity curve shows steady growth with manageable drawdowns. Sharp spikes or deep declines could indicate a strategy that’s too volatile or dependent on a few big wins.
Drawdown charts are equally important. They highlight periods of significant losses and show how long it takes for your strategy to recover. This recovery period can give you a sense of how resilient your approach is during tough times.
Tables can help you break down your results systematically. For instance:
- Performance tables can evaluate how your strategy fares in different market conditions, such as bull, bear, or sideways markets. This analysis helps identify biases that might affect future performance.
- Monthly and yearly performance tables can uncover seasonal patterns or periods of consistent underperformance. If certain months repeatedly show losses, you might adjust your trading during those times.
- Comparison tables are useful when testing variations of your strategy. For example, if you're optimizing a moving average crossover, compare metrics like net profit, drawdown, and Sharpe ratio for different parameter combinations.
Visualizing trade outcomes can also be revealing. Trade distribution charts, like histograms of profit and loss, show whether your strategy relies on a few big wins or delivers consistent results. This insight can guide your position sizing and risk management.
Finally, document everything. A results summary table that captures key metrics, lessons learned, and areas for improvement will be invaluable for refining your strategy or explaining it to others.
Common Backtesting Mistakes to Avoid
Even with solid backtesting methods, certain missteps can skew results and lead to poor decisions when trading in live markets. These errors can turn seemingly profitable strategies into costly failures. Being aware of these pitfalls helps you create strategies that are more likely to succeed in real-world conditions.
Overfitting to Historical Data
Overfitting happens when a strategy is overly tailored to past data, making it perform well in backtests but fail in live markets. Essentially, it’s like fine-tuning a strategy to fit historical "noise" rather than actual market trends. For example, if you see a Sharpe ratio above 3 or unusually low drawdowns, it might signal overfitting to a specific market phase.
This issue often arises when traders adjust too many parameters, use the same time period for both training and testing, or create overly complex models. The urge to tweak endlessly until the results look flawless can lead to unreliable strategies. To avoid this, start with a clear hypothesis about why your strategy should work. Stick to straightforward technical indicators tied directly to your trading thesis, rather than testing endless parameter combinations.
To ensure your strategy holds up in various conditions, split your data into separate training and testing sets. Techniques like walk-forward optimization can help confirm your model’s ability to generalize. Adding small amounts of random noise to your historical data during testing can also reveal whether your strategy is robust enough to handle real-market unpredictability.
Remember, even a well-designed strategy can fail if it ignores real-world factors like execution costs.
Accounting for Slippage and Commissions
A strategy that looks great on paper can fall apart when real-world costs like slippage, commissions, and bid-ask spreads are included. Ignoring these expenses is like planning a road trip without considering fuel costs - it’s simply unrealistic.
To create realistic backtests, you need to factor in all transaction costs. This includes modeling slippage, commissions, and spreads to reflect actual trading conditions. For larger position sizes, market impact becomes especially important. As Dimitris Melas, head of research at MSCI, puts it:
"I've never seen a bad backtest."
To account for these costs, assume some adverse price movement on each trade. Incorporate realistic commission rates, typical bid-ask spreads for your chosen instruments, and expected slippage based on your order sizes and market conditions. Also, consider how these costs might change in different scenarios: slippage often increases during volatile markets, and spreads can widen during periods of low liquidity.
Forward testing through paper trading is a great way to test your assumptions about transaction costs. A few weeks of simulated trading can reveal whether your backtested strategy holds up after accounting for real-world execution expenses. This step ensures your strategy remains profitable even after factoring in all costs.
Using For Traders' Tools for Backtesting
Having the right tools can make all the difference when it comes to backtesting. For Traders offers a variety of platforms and resources designed to help you thoroughly test your trading strategies before committing real money.
Advanced Backtesting on For Traders Platforms
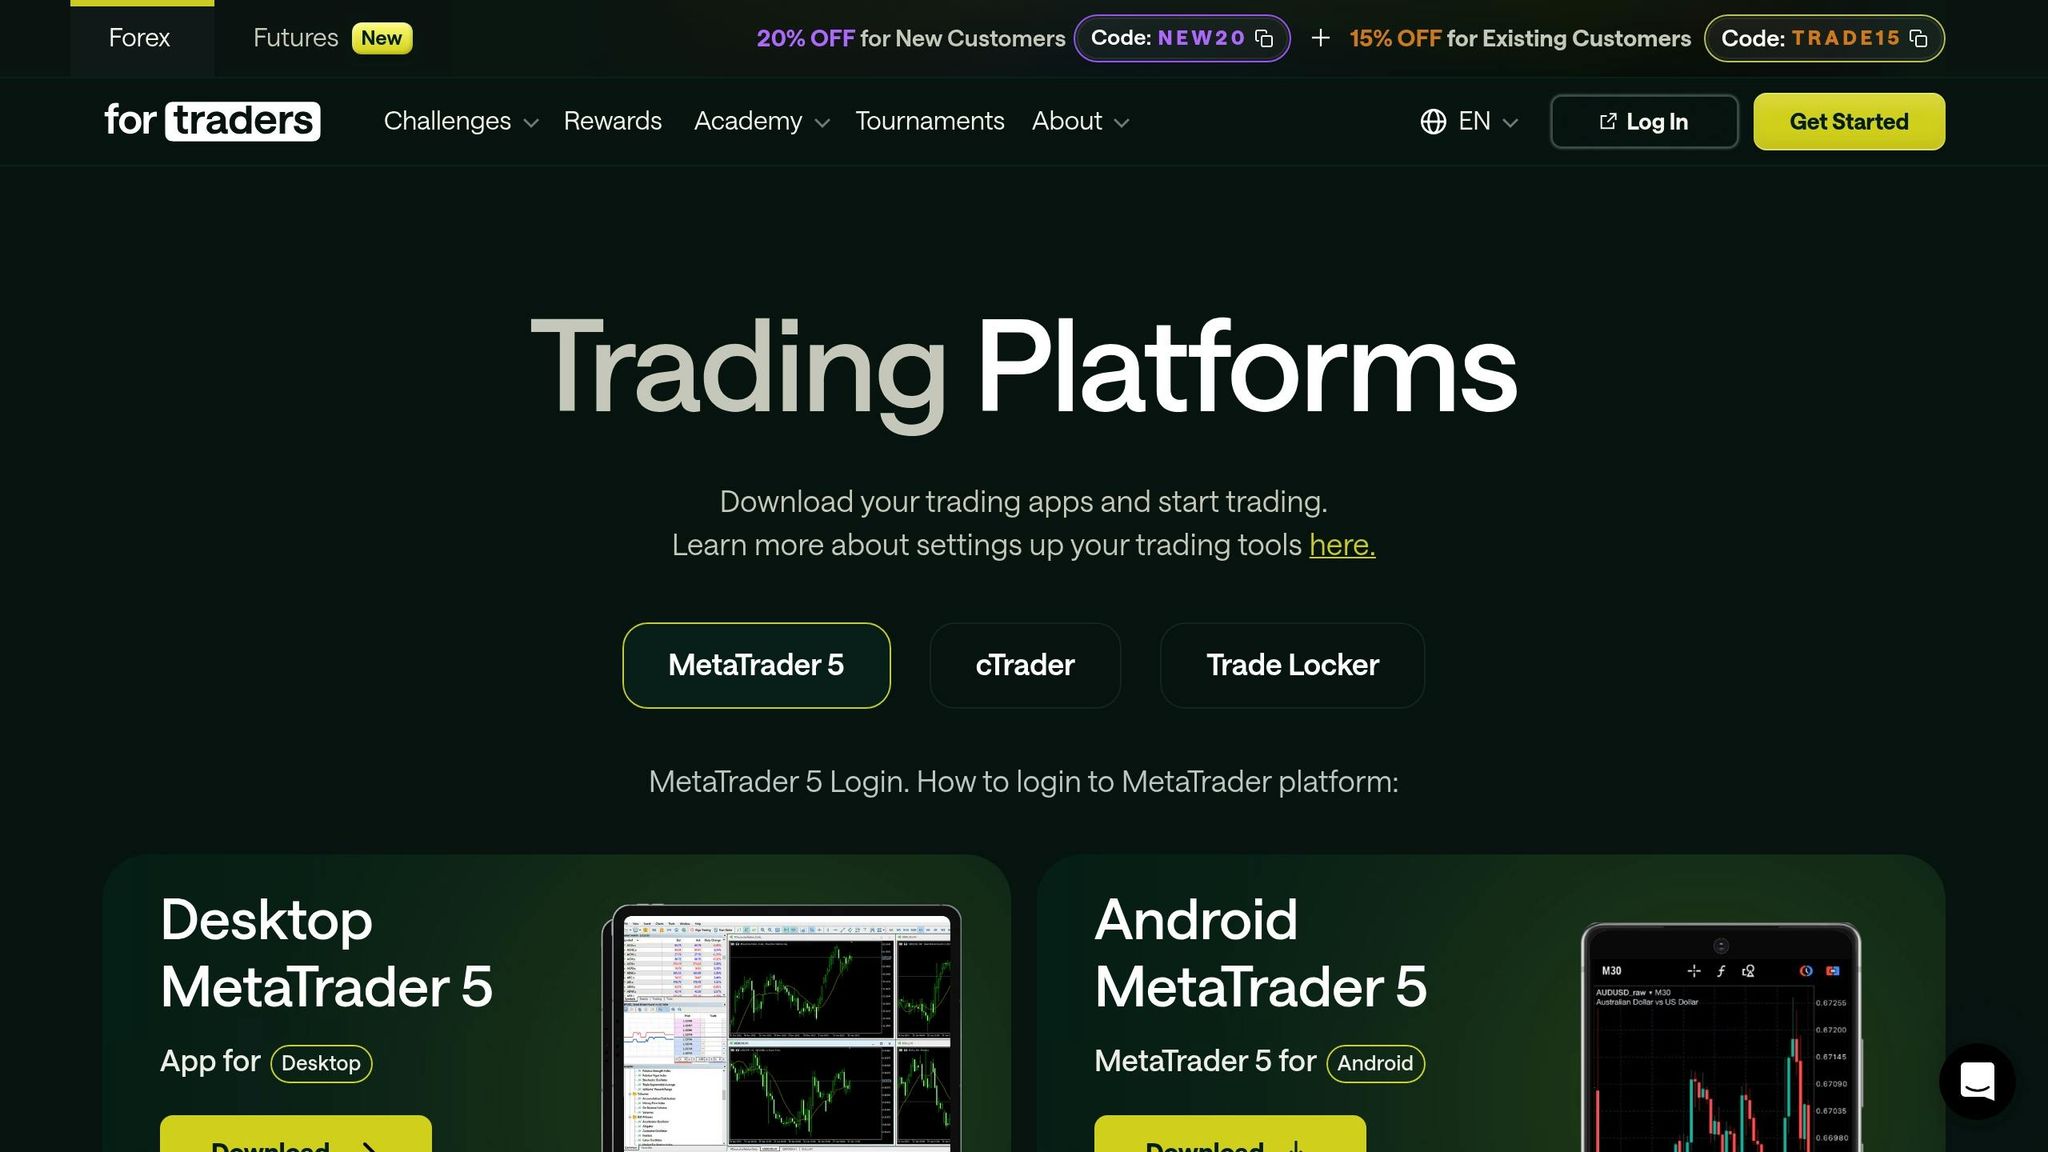
For Traders provides three powerful platforms - DXTrade, TradeLocker, and cTrader - each packed with backtesting features and performance analysis tools. These platforms deliver high-quality data and analytics, offering a seamless transition from backtesting to simulated trading without the hassle of switching software.
- DXTrade: Known for its detailed market data and price history, DXTrade is perfect for strategies that demand precise entry and exit points. Its performance analysis tools let you quickly evaluate metrics like win rates, average trade duration, and maximum drawdowns.
- TradeLocker: This platform simplifies the backtesting process, offering intuitive setup options and clear performance visualizations across different market conditions.
- cTrader: Ideal for algorithmic trading, cTrader combines backtesting with advanced automation capabilities, making it a go-to for traders working on complex, rule-based strategies.
Each platform also accounts for realistic trading costs, such as spreads and commissions, ensuring your backtests reflect actual trading conditions. You can even adjust these parameters to match your specific trading environment and account size.
For those looking to deepen their knowledge, For Traders complements these tools with a range of educational resources, ensuring you’re not just testing strategies but also understanding the process behind it.
Educational Resources for Backtesting
In addition to technical tools, For Traders provides a wealth of educational materials to enhance your backtesting skills. Their 12+ video trading course covers everything from strategy development to benchmarking and interpreting performance metrics. These videos go beyond showing you which buttons to press - they explain the reasoning behind each step, helping you distinguish between reliable and misleading backtests.
For a deeper dive, the platform’s e-books explore advanced topics like avoiding overfitting, adapting to different market conditions, and validating your results with out-of-sample testing. These resources are designed to sharpen your critical thinking, allowing you to identify and address potential issues before they impact live trading.
To further support your learning, For Traders offers community access through Discord, where you can connect with other traders. This peer-to-peer environment is a great place to exchange strategies, share results, and get feedback from individuals with varying levels of experience.
The combination of cutting-edge platforms, educational content, and community support creates a well-rounded learning experience. You can test a strategy on one of the platforms, discuss your findings with the community, and revisit educational materials to better understand emerging patterns. This integrated approach ensures that backtesting becomes a key part of your trading success.
When unexpected results arise or troubleshooting is needed, this mix of tools and knowledge allows you to address challenges efficiently. Instead of relying on guesswork, you can work through issues systematically, building confidence in your backtesting process.
Conclusion: The Value of Backtesting in Trading Success
Backtesting takes trading from a game of chance to a methodical, data-driven practice. As John F. Ehlers put it in Cybernetic Analysis for Stocks and Futures:
"Backtesting is the machine in which we distill market experience into rules".
This approach doesn’t just polish your strategy - it lays the groundwork for consistent performance. By using historical data to simulate trades, backtesting reveals potential risks and helps set realistic expectations. For instance, with 81% of retail CFD accounts losing money, a backtest showing a 60% win rate and a 1:2 risk-to-reward ratio offers valuable insights into how your strategy might hold up under real market conditions.
Here are some key points to keep in mind as you refine your trading strategy through backtesting:
Key Takeaways for Traders
- Quality Data Is Essential: Accurate historical data, including realistic spreads, commissions, and slippage, is the backbone of reliable backtesting. Without it, your results might look good on paper but fail when applied to live trading. Solid data builds the confidence needed to stick to your plan, even during volatile markets.
- Structure Prevents Mistakes: A structured backtesting process - complete with clear entry and exit rules and a thorough analysis of performance metrics - provides actionable insights while steering you clear of pitfalls like overfitting.
- Backtesting Is a Continuous Process: Strategies aren't static. Each round of backtesting should inform tweaks to adapt to evolving market conditions, helping you maintain a competitive edge.
- Combine Backtesting with Forward Testing: Testing strategies on historical data is just the first step. Reinforce your findings by forward testing in real-time simulations. This dual approach transforms trading ideas into measurable, data-backed strategies that can perform consistently in simulated prop trading environments.
Backtesting isn’t just a tool - it’s a critical part of developing and refining a trading strategy that stands the test of time and market fluctuations. By integrating it into your routine, you set the stage for smarter, more disciplined trading.
FAQs
How can I make sure the historical data I use for backtesting is accurate and trustworthy?
When preparing historical data for backtesting, the first step is to gather it from trusted sources known for delivering accurate and consistent information. This ensures the foundation of your analysis is solid.
Once you have the data, take time to verify it. Conduct visual inspections, run statistical checks, and make sure there are no gaps or errors that could skew your results. Any irregularities, like sudden price spikes or missing data points, should be cleaned and adjusted to align with your trading strategy.
Using reliable, well-prepared data is key to generating meaningful backtest results and steering clear of misleading outcomes.
How can I prevent overfitting when creating a trading strategy?
To reduce the risk of overfitting in your trading strategies, start by dividing your historical data into two parts: a training set and a testing set. A common approach is an 80/20 split, where 80% of the data is used for training and 20% is reserved for testing. This allows you to evaluate your strategy on data it hasn’t seen before, offering a more realistic measure of its performance. Additionally, using out-of-sample data for validation can help verify the strategy’s reliability.
Other useful techniques include regularization, early stopping, or ensembling, which can help ensure your model doesn’t become overly focused on random noise in the data. Forward testing in a simulated or demo trading environment is another great way to see how your strategy performs in real market conditions - without putting your funds at risk.
These steps can help you create strategies that are better equipped to handle the challenges of live trading.
How can I include slippage and commissions in my backtesting for more accurate results?
To get realistic backtesting results, you need to factor in slippage and commissions, as these costs can have a big impact on your trading outcomes. Start by simulating slippage based on variables like market volatility, order size, or liquidity. For instance, you might use a percentage-based slippage model or a dynamic approach that adjusts as market conditions shift.
When it comes to commissions, make sure to include transaction costs in your calculations. This could mean applying a flat fee per trade or a percentage of the trade's value, depending on how your broker structures their fees. Accounting for these elements ensures your backtests mirror real trading conditions more closely, giving you a clearer picture of how your strategies might perform in the market.
Related Blog Posts
Start Trading with For Traders
Join our platform to test your trading skills, trade virtual capital, and earn real profits. Access educational resources, advanced tools, and a supportive community to enhance your trading journey.
Start your Trading Challenge