
Prop trading success isn’t just about market knowledge - it’s about discipline, risk management, and emotional control. Most traders fail due to avoidable mistakes like over-leveraging or revenge trading. Here’s how you can use feedback to refine your strategies and improve results:
- Track Key Metrics: Focus on profit factor, expectancy, drawdowns, and win rate vs. risk-reward ratio. Analyze patterns like time of day or asset class performance.
- Leverage Tools: Platforms like For Traders provide AI-driven insights and risk checks to help you identify weaknesses.
- Engage with Communities: Share charts, seek feedback, and learn from experienced traders to uncover blind spots.
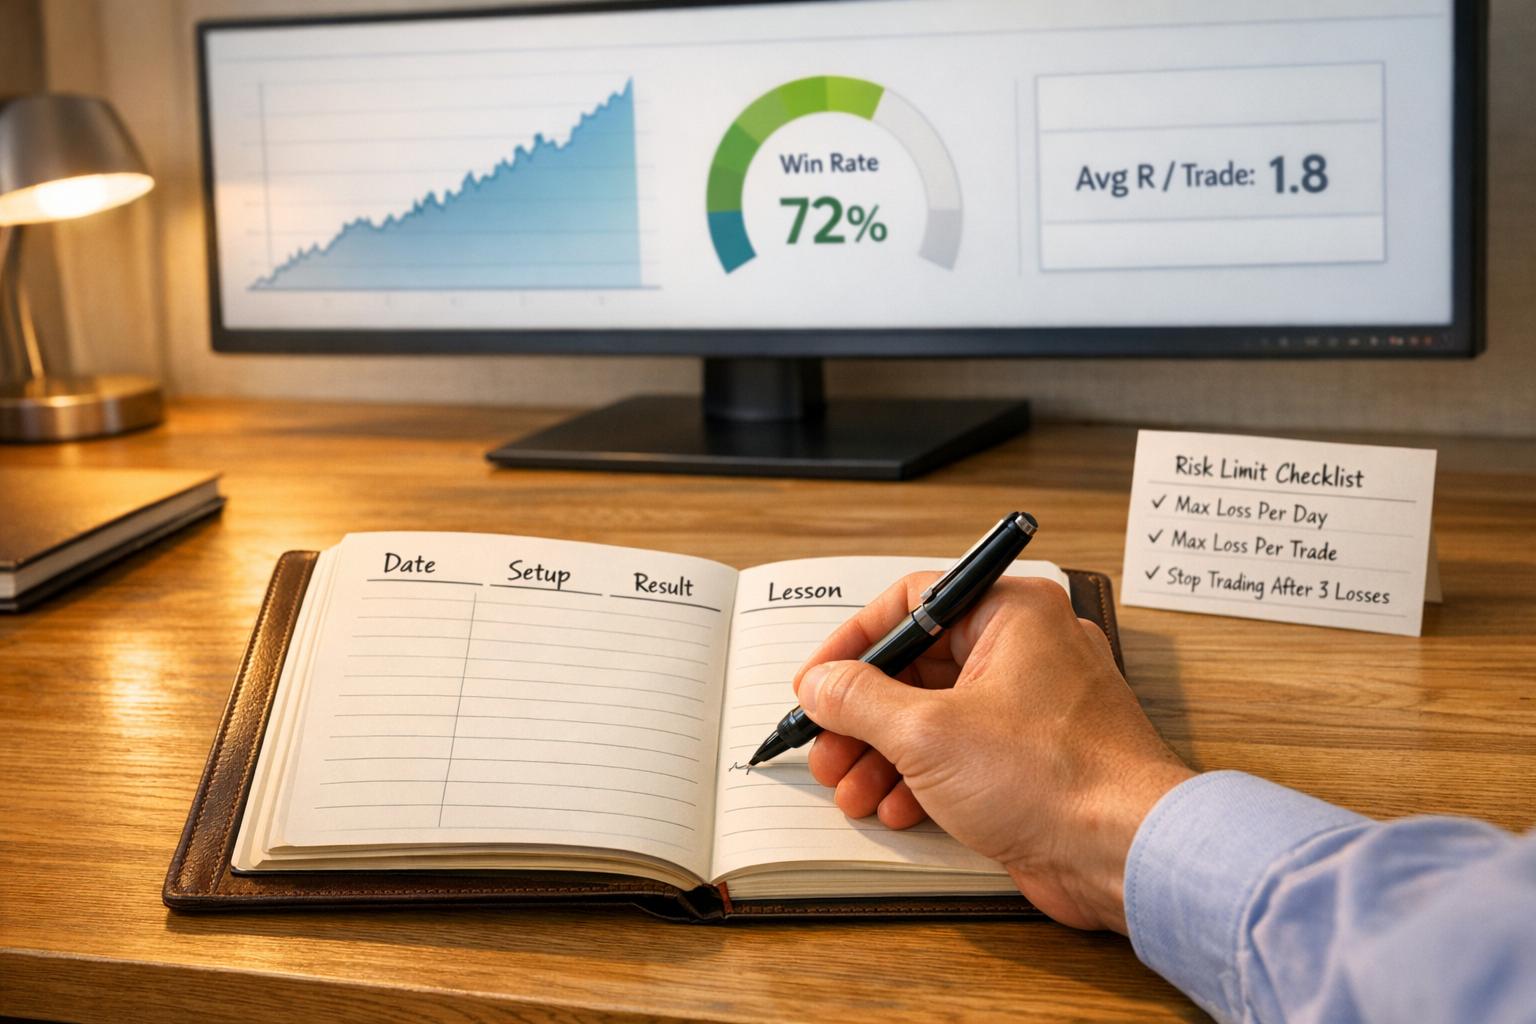
- Maintain a Trading Journal: Document every trade, including emotional states and execution details, to spot recurring issues.
- Refine Risk Management: Adjust position sizing, stop-losses, and daily limits based on feedback to reduce emotional trading and extend longevity.
- Test Updates: Use simulations and backtesting to validate changes before applying them in live challenges.
- Review Regularly: Conduct daily, weekly, and monthly reviews to stay on track and refine strategies.

6-Step Feedback Loop for Improving Prop Trading Performance
Collecting Feedback from Your Trading Evaluations
The first step to improving as a trader is figuring out where to gather meaningful feedback. Many traders glance at their profit and loss (P&L) statements and move on, missing out on the deeper insights that could drive their growth. To truly improve, you need a combination of detailed data analysis and input from the trading community. Let’s dive into how to pull actionable feedback from both your metrics and community interactions.
Reading Your Performance Metrics
Every trading platform churns out a variety of metrics after each evaluation, but not all of them are equally useful. Focus on key indicators like profit factor (gross profits divided by gross losses), expectancy (average expected win or loss per trade), and maximum drawdown (your largest drop from peak to trough). These numbers paint a clearer picture of your trading performance.
Platforms like For Traders offer AI-driven reports that calculate these metrics automatically. For example, if you're aiming for a 9% profit target with a 5% maximum drawdown limit, your data should confirm you’re staying within those limits. A profit factor above 1.75 signals strong performance, while a 1.2 suggests there’s work to be done.
Another critical pairing is your win rate versus risk-reward ratio. A 35% win rate might seem low, but if your winning trades are three to four times larger than your losses, you’re on solid ground. On the flip side, a 65% win rate won’t cut it if your losses outweigh your gains. The math simply won’t add up for long-term success.
"A handful of properly tracked numbers separates luck from repeatable edge - trade-level slippage, expectancy, drawdown behavior, and position-sizing outcomes tell different stories than monthly returns alone." - Joshua Okapes, Forex Trader
Dig deeper into your trade history by filtering for asset class and time of day. For example, you might discover that most of your profits come from trading Gold between 8:00 AM and 11:00 AM EST, while your EUR/USD trades are consistently unprofitable. This kind of insight gives you a clear direction for improvement.
Using Community and Educational Resources
While metrics tell you what happened, community feedback can help explain why. Platforms like the Discord community on For Traders connect you with other traders who can identify patterns you might overlook. Sharing a chart markup that includes your entry, exit, and stop-loss levels invites diverse perspectives that can validate - or challenge - your technical analysis.
Mentored trading groups also offer a major advantage. Studies show that these groups achieve an 82% success rate, compared to just 27% for traders learning on their own. This difference often comes down to experienced traders spotting behavioral tendencies - like revenge trading after a loss or impulsive entries driven by FOMO - that raw data won’t highlight.
Educational resources like video courses and e-books can also help you zero in on specific weaknesses. For instance, if your drawdowns consistently hover near the 5% maximum, a course on position sizing might teach you how to better align your risk with your strategy’s historical volatility.
Make it a habit to spend 30–60 minutes daily engaging with the community, but be selective. Focus on content that aligns with your trading style - whether it’s day trading, swing trading, or scalping. By contributing detailed trade reviews, you’ll not only sharpen your own analysis but also receive targeted feedback from traders who’ve faced similar challenges.
With a strong grasp of both your performance metrics and the insights from your trading community, you’ll be well-positioned to identify recurring patterns and take meaningful steps toward improvement.
Finding Patterns in Your Feedback
Take the data and insights you've gathered and turn them into patterns you can act on. A lot of traders only review their results after losses or when something feels off. That reactive mindset can cost you. Instead, adopt a structured review system that separates luck from skill and pinpoints where your advantage lies.
Top traders rely on a three-step review process: daily checks to ensure you’re sticking to your rules, weekly reviews to analyze setup performance and session trends, and monthly deep dives to study expectancy and risk metrics. This method helps cut through short-term noise and uncovers behavioral patterns before they impact your profits. Building on feedback collection, this section focuses on spotting recurring patterns and refining your approach.
Keeping a Trading Journal for Better Analysis
A trading journal turns your subjective memory into objective data. It’s like creating a personal database of your performance, showing you what you actually do - not just what you think you do. The key is to log trades within 24 hours. Wait too long, and your memory of your mindset and the market’s context fades.
For each trade, record:
- Your pre-entry thesis
- Entry and exit points
- Position size
- Your emotional state (e.g., "calm", "anxious", or "FOMO")
Tagging trades with emotional descriptors can help you identify triggers that lead to bad habits like revenge trading or premature exits. For instance, you might notice that trades taken within 30 minutes of a loss have a 25% higher loss rate. That’s a clear sign to enforce a mandatory cool-off period.
Attach screenshots of your entry and exit charts to check if your execution aligned with your original plan.
"If you're not journaling, you're gambling." - FX Replay
After logging 30 to 50 trades, calculate the expectancy of each setup using this formula:
(Win % × Average Win) – (Loss % × Average Loss).
If a setup consistently drains your capital, it’s time to remove it from your playbook, no matter how appealing it looks on paper.
Reviewing For Traders Metrics for Trends

While a journal captures your personal tendencies, platform metrics can reveal broader trends. For Traders offers AI-driven reports that calculate key indicators automatically, but it’s up to you to focus on the numbers that matter.
Start by tracking metrics like your bi-weekly payout eligibility and profit share percentage (usually 15%). If you’re not hitting the 9% profit target or are breaching the 5% drawdown limit, it’s a sign your risk settings need tweaking. These metrics act as early warnings, helping you adjust during weekly reviews before major losses occur.
Filter your trade history by setup type and market session. For example:
- Breakout trades during the London session (3:00 AM–12:00 PM EST) might have a 70% win rate.
- Pullback trades during the New York session (8:00 AM–5:00 PM EST) could consistently underperform.
Also, track MAE (Maximum Adverse Excursion) and MFE (Maximum Favorable Excursion). These metrics help fine-tune your stop-loss and take-profit levels:
- MAE shows how far a trade moved against you before reversing.
- MFE shows how far it went in your favor before pulling back.
| Metric | Purpose | Key Insight |
|---|---|---|
| Expectancy | Measures system edge | Reveals if your strategy is profitable long-term |
| Profit Factor | Ratio of gross profit to gross loss | Shows the efficiency of your trading system |
| Win Rate | Percentage of profitable trades | Identifies which setups have the highest potential |
| R-Risk (Units) | Standardizes performance by risk | Keeps results consistent regardless of account size |
Measuring performance in "R" units helps you avoid emotional decisions tied to large nominal gains or losses.
"A simple journal beats a complex one you never fill out." - FundingRock
One of the biggest mistakes traders make is overcomplicating their tracking systems. A journal with 30+ variables might sound thorough, but most people abandon it after a week. Keep it simple - focus on metrics that directly guide your next steps and stick to a regular review schedule. Consistency always wins over complexity. These patterns will directly inform the risk management strategies discussed later in the article.
Updating Your Risk Management Using Feedback
Once you've spotted patterns in your trading data, the next step is to use those insights to refine your risk management strategies for day trading. This isn't about making random guesses - it’s about making informed adjustments based on how you’ve performed. Over 95% of prop firm evaluation failures stem from poor risk management, not bad trading strategies. The ability to pass often hinges on how well you respond to performance feedback.
Adjusting Your Risk Parameters
Start by addressing the weaknesses highlighted in your evaluations. For instance, if your Max Adverse Excursion (MAE) data shows frequent stop-outs before trades move in your favor, it might mean your stops are too tight. Using ATR-based stops set at 1.5x–2x the Average True Range can help account for market volatility and reduce premature exits caused by "whipsaw" movements.
Position sizing is another critical area. If you’ve hit drawdown limits or breached daily loss thresholds, consider dynamic risk scaling. For example, after a loss, reduce your position size by half (e.g., from 1% to 0.5%) and only return to full size once you’ve recovered the loss. This adjustment can significantly extend your ability to absorb losses, increasing your survival from 11 consecutive 1% losses to 17 or more losses with the smaller risk size.
Set circuit breakers to keep emotions in check. For example, stop trading if you hit 50–60% of your daily loss limit or 70% of a 5% drawdown threshold.
"Amateurs ask: 'How much can I make?' Professionals ask: 'How much can I lose without breaking my system?'" – FunderPro
Take Sarah Chen’s example: she passed her FTMO $100,000 challenge in early 2026 by limiting her risk to 0.75% per trade and stopping entirely after two consecutive daily losses. This ensured her largest loss never exceeded $750, while she maintained a disciplined 1:2 risk-to-reward ratio.
If you trade correlated pairs, keep an eye on your exposure. For instance, going long on both EUR/USD and GBP/USD at the same time can unintentionally double your risk in the same direction. Limit yourself to no more than two correlated positions to avoid over-leveraging.
Once you’ve made these adjustments, the next critical step is to measure their impact.
Comparing Before and After Adjustments
Making changes is only half the battle - you need to track whether they’re actually helping. Without comparing your results, you won’t know if your adjustments are improving your edge or creating new problems. Document and analyze key feedback issues to confirm whether your changes are effective.
For example, if you were breaching your daily loss limit with a 5% cap, track how switching to a 2.5% internal hard stop affects your ability to avoid emotional trading. If tight 10-pip stops were causing high MAE, monitor your win rate after switching to ATR-based stops. Mike Rodriguez, for instance, failed three TopStep evaluations in 2026 before implementing a "50% of daily limit" hard stop. On his fourth attempt, he passed the $50,000 combine with a 60% win rate and a maximum drawdown of just $840, staying well within the prescribed limits.
| Feedback Issue | Original Parameter | Adjusted Parameter | Expected Impact |
|---|---|---|---|
| High MAE (stopped out early) | Tight 10-pip stop | ATR-based stop (1.5x ATR) | Reduce whipsaw exits; improve win rate |
| Daily limit breaches | 5% daily limit | 2.5% internal hard stop | Prevent emotional spirals; avoid account termination |
| Large drawdown spikes | 2% risk per trade | 0.5%–1% risk per trade | Smoother equity curve; increased longevity |
| Profit erosion | No exit rule | 1R profit giveback trigger | Protect net gains; improve realized profit factor |
Test each adjustment over a 7-day period, comparing your MAE before and after implementing ATR-based stops. Focus on tracking performance in R-multiples (units of risk) rather than dollar amounts. This keeps your analysis consistent across different instruments and account sizes. It’s a practical way to focus on risk-adjusted returns instead of getting distracted by nominal gains or losses.
Testing Your Updated Strategies with Simulations
After tweaking your risk parameters, it's essential to test your new strategies in a simulated environment. This step ensures they can handle live trading conditions effectively. By running these tests rigorously, you could achieve an average profitability increase of 30%.
The goal is to replicate real market conditions as closely as possible. Use the same trading platform, account for factors like spreads and slippage, and test your strategies across various market scenarios - bullish, bearish, and sideways markets. This approach helps confirm that your adjustments can hold up under different conditions.
Practicing with Virtual Capital
Platforms like For Traders offer a great way to test your strategies using virtual capital. They provide simulated trading challenges with account sizes ranging from $6,000 to $100,000. This lets you practice and refine your strategies without putting your own money at risk. Start small with a virtual account to test your adjustments. A 30-day "shadow phase" can be particularly effective - execute all signals in a simulated account and track how many you take versus how many you miss. This data can reveal whether hesitation or judgment errors are affecting your performance.
When scaling to larger accounts, pay close attention to how order execution changes with higher position sizes. Many strategies that look good in backtests fail in live markets - 70% of them, in fact - often due to execution frictions like slippage or partial fills. Make sure to include realistic estimates for transaction costs, considering factors like the type of order and the time of day.
Once you've practiced with virtual capital, the next step is to validate your strategies through thorough backtesting.
Backtesting Your Changes
Backtesting transforms your strategy adjustments into a systematic process. Start by defining clear rules for entries, exits, stop-losses, and position sizing - this eliminates any ambiguity. Use at least 10 years of historical data to cover different market conditions and reduce the risk of relying on too small a sample size.
Run your strategy in a chronological order, ensuring you only use information available at each point in time. Focus on risk-adjusted metrics like a Profit Factor above 1.5, a Sharpe Ratio over 1.0, and a Maximum Drawdown below 20%. These benchmarks help you determine whether your strategy has a real edge or if it's just benefiting from a few lucky trades.
For statistically meaningful results, aim for a sample size of at least 30 trades, though 200 to 500 trades are ideal for higher confidence levels. To further validate your strategy, use Monte Carlo resampling to analyze how returns vary with different trade sequences. This helps identify whether your strategy depends too heavily on a few big wins.
"Ignoring transaction costs can result in a 30% overestimation of strategy profitability." – LuxAlgo Blog
Set aside a portion of historical data for out-of-sample testing. This "blind" test ensures your strategy isn't just overfitted to past data noise. Testing your strategy on multiple assets is also important, as each instrument comes with its own volatility and liquidity challenges.
Finally, document everything. Keep a record of the exact data, code version, and simulation settings used for each test. This audit trail not only ensures reproducibility but also provides a solid baseline for comparing results when you apply your changes in real-world scenarios. By consistently testing and refining your strategies through simulations, you create a reliable process for improving your trading performance over time.
Applying Changes and Tracking Your Progress
Transitioning from simulations to live prop challenges is a crucial phase in your feedback loop. This is where you apply your refined strategies, aiming to meet profit targets while keeping drawdowns under control.
Using Your Adjustments in New Challenges
Begin by testing your updated strategy during the Phase 1 Evaluation of a prop challenge. Narrow your focus - stick to trading only 1–3 instruments. This approach helps boost consistency and minimizes the confusion that often leads to errors or failures. Stick to a repeatable session workflow, and make sure to close all trades by the end of each session to avoid overnight risks.
Take advantage of tools like the For Traders dashboard to monitor real-time metrics. Enforce strict risk limits of 0.25%, 0.50%, or a maximum of 1.00% per trade. Keep journaling to track your execution quality and emotional patterns during live trading, using the structured approach you've already developed.
After hitting major milestones, step back for a one-day break to reset mentally. Engage with other traders through Discord and Telegram groups to exchange insights, learn from those who've passed evaluations, and pick up strategies for better emotional control. From there, progress to a Master Account, where you can earn payouts and scale your capital based on performance.
As you apply these adjustments, continuously evaluate their impact and refine your strategy accordingly.
Repeating the Process for Long-Term Results
Consistently track your performance by updating your records after every trade or session. Use multiple review timeframes: daily reviews to catch execution errors, weekly checks to ensure losses stay within 3%–5%, and monthly or quarterly reviews to analyze long-term trends using metrics like win rate, profit factor, and Sharpe ratio. These reviews tie back to the risk management tweaks and behavioral patterns you've previously identified, reinforcing the feedback loop.
"The market does not care about your potential. It only rewards your execution." – Trader Zhang
Build a detailed playbook that outlines each refined setup, complete with rules and screenshots, so you can consistently replicate high-probability trades. Explore the educational materials on For Traders, such as video courses and e-books, to keep improving your approach. Base any strategy changes on a large enough sample size to avoid overreacting to isolated bad trades.
The process is ongoing: plan carefully, execute with discipline, analyze your results, and refine your methods. This iterative cycle is what separates successful traders from those who struggle, paving the way for steady progress, consistent payouts, and a sustainable trading career.
Conclusion
Building better results in prop trading comes down to following a clear, repeatable process. Start by gathering performance data, analyze it to uncover patterns in your trading behavior, fine-tune your risk management and trading rules, and test those updates through simulations. Once you've refined your approach, implement it in live trading challenges while using your trading journal to improve. This cycle of reviewing and improving is essential as you work toward consistent performance in live trading.
The secret lies in staying consistent over time. According to research from Harvard Business School, deliberate reflection on tasks can improve performance by nearly 23%. The process involves planning, executing, analyzing, and refining. To make this manageable, break your reviews into smaller sessions: spend 5 minutes daily, 30 minutes weekly, and 1–2 hours monthly. This way, you stay on top of your growth without feeling overwhelmed.
"Your trading journal is not a diary; it's a business ledger for your edge." – The Wager Theorem
Platforms like For Traders make this process easier by offering centralized dashboards, structured risk management tools, and a wealth of educational resources, such as video courses, e-books, and a supportive Discord community. By sticking to this disciplined, iterative approach - and leveraging tools like For Traders - you can lay the groundwork for consistent, long-term success in prop trading.
FAQs
Which metrics matter most for prop evaluations?
Key metrics for evaluating prop trading performance include profit targets, risk management, consistency, drawdown limits, and execution quality. These factors showcase a trader's ability to deliver returns while keeping risks under control and following established guidelines. Prioritizing these elements is essential for proving trading skill and dependability.
How do I spot patterns in my trading feedback fast?
To spot patterns in your trading feedback, it's crucial to systematically analyze your trade data. Pay close attention to critical metrics like your win rate, risk-reward ratios, and the market conditions at the time of each trade. Establish a structured review routine - this could include quick daily checks paired with more in-depth weekly evaluations - to uncover consistent behaviors or trends. Maintaining a detailed trading journal is also invaluable. By recording notes on your emotional state and the market environment, you might uncover subtle patterns that aren't immediately obvious.
When should I change risk rules versus the strategy?
When market conditions shift or evaluation parameters are updated - like new firm rules or feedback - it’s crucial to tweak your risk rules. This might involve rethinking position sizing, adjusting stop loss placements, or revisiting drawdown limits to align with the new environment.
On the other hand, changes to your strategy, such as altering entry or exit setups, should only happen after a detailed performance review. Make sure your risk management framework is solid and clearly defined before making any strategic adjustments.
Related Blog Posts
Start Trading with For Traders
Join our platform to test your trading skills, trade virtual capital, and earn real profits. Access educational resources, advanced tools, and a supportive community to enhance your trading journey.
Start your Trading Challenge