

Volatility-based position sizing (VBPS) helps traders manage risk by adjusting trade size according to market volatility. This approach ensures consistent risk levels, regardless of how unpredictable the market becomes. Here's why it matters:
- Risk Consistency: VBPS adjusts position sizes to maintain steady dollar risk, even during volatile periods.
- Improved Performance: Studies show it can increase profit factors (e.g., 1.76 to 2.08) and reduce maximum drawdowns by up to 25%.
- Emotional Control: By relying on data like Average True Range (ATR), VBPS removes guesswork and emotional decision-making.
Key Methods:
- ATR-Based Sizing: Uses ATR to calculate position sizes dynamically.
- Percent Volatility Model: Allocates a fixed risk percentage adjusted for asset volatility.
- Fixed Percentage with Volatility Adjustment: Combines fixed risk with volatility-based scaling for precision.
Formula:
Position Size = (Account Risk Dollars) ÷ (ATR × Multiplier)
This method works across assets like stocks, crypto, and commodities, ensuring balanced risk exposure. Backtests and simulations confirm its effectiveness in smoothing returns and protecting capital during market swings. Start by testing VBPS in a simulated account to refine your strategy before going live.
Research Findings on Volatility-Based Position Sizing
Effects on Risk-Adjusted Returns
Studies highlight that using volatility-based position sizing can significantly improve risk-adjusted performance. In a five-year analysis (August 2021 to February 2026), Louis Llanes, CFA, CMT, compared two portfolios containing Robinhood (HOOD), Gold (OUNZ), Hershey (HSY), and the S&P 500 (IVV). When the portfolio shifted from equal weighting to inverse volatility weighting - based on a rolling 12-month standard deviation - the Sharpe ratio increased from 0.99 to 1.54. At the same time, the maximum drawdown decreased notably, from –30.84% to –13.81%.
This improvement is largely attributed to the "throttle effect." Volatility-based sizing adjusts exposure automatically, reducing it during turbulent periods and increasing it during calmer ones. This systematic adjustment also lowers Value at Risk (VaR) during periods of market instability by cutting position sizes when volatility surges. By smoothing returns and mitigating drawdown severity, this approach helps traders avoid panic-selling during challenging market conditions.
"How you size positions and manage risk is just as important as what you buy."
- Louis Llanes, CFA, CMT
Backtesting Results
Backtesting further supports the benefits of dynamic position sizing. Static position sizing often misrepresents risk. When traders use a fixed number of contracts without accounting for market conditions, their actual risk can fluctuate significantly.
For example, a dynamic 0.5% risk model adjusts positions based on market volatility, ranging from 1.11 contracts during high-volatility periods to 6.25 contracts during calmer times. This ensures that risk remains capped at $50 per trade. In contrast, traders relying on static sizing during low-volatility phases may miss out on as much as 40% of potential profits because they under-risk relative to their targets.
"Static position sizing isn't just ineffective, it's dangerous. And if you're using it in your backtests, you're not testing what you think you're testing."
Long-term simulations reinforce these findings. A trend-following model using Volatility Targeting (VT) from 1980 to 2024 achieved a 60% monthly hit ratio and a solid Sharpe ratio, demonstrating consistent and stable performance. The data underscores that volatility-based sizing not only minimizes risk but also enhances compound growth by allowing profits to build efficiently while shielding against large losses during volatile periods.
3 Volatility-Based Position Sizing Models
ATR-Based Position Sizing
The ATR-based model uses the Average True Range (ATR) to adjust position sizes based on market volatility. When volatility rises, position sizes decrease; when it falls, they increase. This method also helps set stop-loss levels beyond typical market fluctuations.
Here’s the formula:
Position Size (Units) = (Account Equity × Risk %) / (ATR × Multiplier)
Traders usually rely on a 14-period ATR as the standard and apply a multiplier between 1.5× and 3.0×. Lower multipliers suit aggressive strategies, while higher ones provide more room for strategies requiring flexibility.
"Using ATR to adjust position size transforms risk management from a static discipline into a dynamic, adaptive system."
- QuantStrategy.io Team
For example, if you’re risking $1,000, an ATR of 1.20 with a 2.0 multiplier calculates to about 417 units, whereas an ATR of 3.50 with a 3.0 multiplier reduces the position to roughly 95 units. This adaptability is also a key feature of the Percent Volatility Model.
Percent Volatility Model
The Percent Volatility Model works similarly to the ATR-based method but focuses on a predefined risk percentage tied to volatility. By dividing a fixed percentage of your account (commonly 1% or 2%) by a volatility measure like ATR or standard deviation, this model ensures consistent dollar risk across various assets. For instance, it balances the risk between a volatile tech stock and a more stable utility ETF. Larger positions are permissible in calmer markets, while volatile conditions naturally shrink position sizes.
"Position sizing allows traders to convert uncertainty into a number they can control."
- Adelin, Trader and Researcher
One important safeguard in this model is setting a portfolio heat ceiling, which limits total open risk - often capped at around 5% - to prevent correlated losses from spiraling out of control. This model thrives in markets with frequent shifts in volatility.
Fixed Percentage with Volatility Adjustment
This method combines a fixed risk percentage with volatility scaling for added precision. You risk a set percentage of your equity (commonly 1% or 2%) on each trade, but the actual position size is adjusted using a volatility-based stop-loss formula:
Position Size = (Account Equity × Risk %) / (ATR × Multiplier)
For example, in a $50,000 account risking 1% per trade, a stock with an $8.00 ATR and a 2.5 multiplier would result in about 25 shares. Meanwhile, for a lower-volatility asset with a $0.50 ATR and a 3.0 multiplier, you could take on 333 units. This approach ensures that a $1.00 price move represents the same proportional risk across all assets.
Volatility Position Sizing: Adapting Your Strategies to Market Volatility
Model Comparison
Volatility-Based Position Sizing Models Comparison Chart
Building on prior research, these models demonstrate how volatility-driven adjustments can directly influence risk management strategies.
Each volatility-based position sizing model brings specific benefits tailored to different trading styles and market conditions.
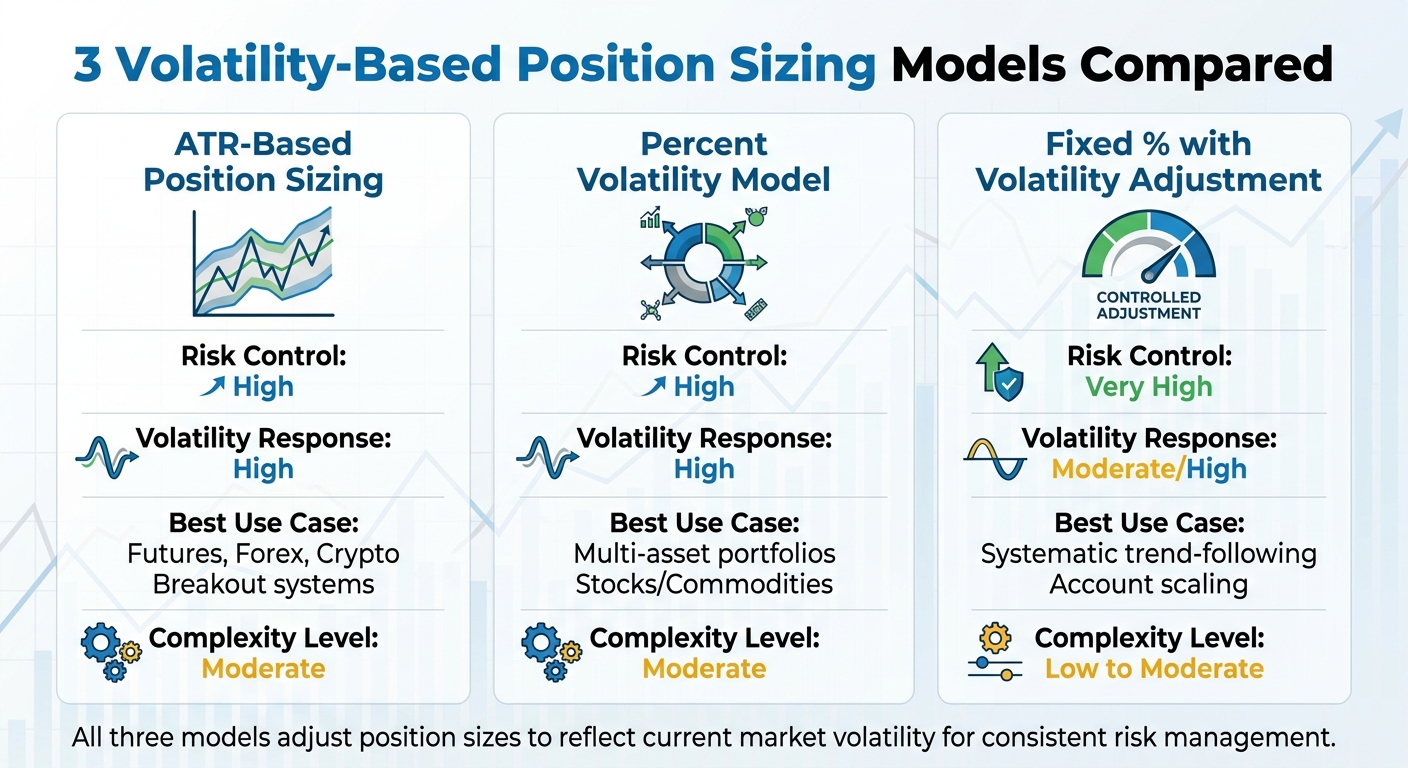
ATR-Based Position Sizing is particularly effective in highly volatile markets such as futures, forex, and crypto. By using the Average True Range (ATR) to dynamically adjust stop-loss levels, this model helps traders avoid premature exits in choppy conditions while safeguarding capital during sudden volatility spikes.
The Percent Volatility Model works well for multi-asset portfolios that include stocks, commodities, and other instruments. It balances risk by aligning the position size of each asset with its volatility relative to the total account equity, making it a strong choice for long-term investors managing diverse holdings.
Fixed Percentage with Volatility Adjustment combines ease of use with accuracy. This model adjusts the number of units traded based on a volatility-derived stop-loss, ensuring that a fixed percentage of total capital is risked on each trade. It’s a great option for systematic trend-following strategies aimed at steady account growth. Unlike ATR-based methods, it requires less frequent recalibration, making it beginner-friendly.
All three models adjust position sizes to reflect current market volatility, ensuring consistent risk management.
Performance Comparison Table
The table below highlights key differences across these models, focusing on their performance metrics:
| Model | Risk Control | Volatility Response | Best Use Case | Complexity Level |
|---|---|---|---|---|
| ATR-Based | High | High | Futures, Forex, Crypto; Breakout systems | Moderate |
| Percent Volatility | High | High | Multi-asset portfolios; Stocks/Commodities | Moderate |
| Fixed % with Vol. Adjustment | Very High | Moderate/High | Systematic trend-following; Account scaling | Low to Moderate |
Each model handles market volatility uniquely. In high-volatility scenarios, all three reduce position sizes to protect capital, but the ATR-based model responds most dynamically to immediate changes in price ranges. Conversely, during low-volatility periods, these models allow for larger position sizes to make better use of available capital. However, fixed percentage methods may underutilize capital compared to approaches that account for volatility .
How to Apply Volatility-Based Position Sizing
Using Volatility Sizing on Trading Platforms
Here’s a practical approach to implementing volatility-based position sizing in your trading routine.
Start with these four key steps:
- Choose your ATR (Average True Range) indicator - typically, a 14-day period works well.
- Set your risk per trade, generally between 0.5% and 2% of your account equity.
- Select an ATR multiplier (usually 1.5× to 3.0×) to account for market fluctuations.
- Use the following formula to calculate your position size:
Position Size (Units) = Account Risk Dollars / (ATR Value × ATR Multiplier).
Many trading platforms, such as DXTrade, TradeLocker, and cTrader, support custom scripts and automation to streamline this process. These platforms use AI-driven tools to monitor your trades and adjust position sizes automatically as market volatility shifts. This ensures your dollar risk remains consistent, even when market conditions change.
"Using ATR to adjust position size transforms risk management from a static discipline into a dynamic, adaptive system."
- QuantStrategy.io Team
To tailor ATR settings to your trading style, adjust the lookback period. For day traders, a 5-period ATR captures short-term volatility spikes. Position traders, on the other hand, may prefer a 20- to 40-period ATR to smooth out market noise. During volatile markets, a higher multiplier (like 3.0×) can help avoid premature stop-outs, while a lower multiplier (around 1.5×) works better in calmer conditions.
Let’s explore how this approach plays out with a real-world example.
Case Study: Simulated Trading with Volatility Models
Take a systematic trader using a For Traders simulated account with $25,000 in virtual capital. During a period resembling the March 2020 volatility spike, the trader set a risk level of 0.5% per trade ($125). With a 5-day ATR of $45, the dynamic sizing formula limited the position size to 1.11 contracts. Fast forward to July 2021, when the ATR dropped to $8, the same $125 risk allowed the trader to scale up to 6.25 contracts. This adjustment ensured consistent dollar risk as market volatility shifted.
The simulation highlighted a key advantage of volatility-based sizing: it maintained the target 0.5% risk across varying market conditions. In contrast, static sizing led to inconsistent exposure during periods of changing volatility.
For Traders users can take this a step further by running dual backtests: one with static sizing and another with volatility-adjusted sizing. Comparing these results helps confirm whether a strategy remains effective across different volatility environments before committing real funds.
Conclusion
Benefits of Volatility-Based Position Sizing
Volatility-based position sizing brings a dynamic edge to risk management by adjusting your capital allocation in real time. This approach keeps your dollar risk consistent, whether the market is calm or experiencing heightened turbulence. For example, during volatile periods like March 2020, it automatically reduces exposure to help protect against significant losses. In quieter times, it allows for larger positions, making better use of your capital.
Quantitative studies show that this method can lower maximum drawdowns by up to 25% while improving profit factors from 1.76 to 2.08 when applied to volatile assets. Beyond the numbers, it helps traders stay objective by relying on measurable data like the Average True Range (ATR) rather than emotional decision-making.
These advantages provide a solid foundation for moving forward with this strategy.
Next Steps for Traders

Start by choosing a reliable volatility metric - many traders find the 14-period ATR to be effective - and set your risk parameters, usually between 0.5% and 2% of your account equity per trade. Use this formula to calculate position size:
Position Size = (Account Risk Dollars) ÷ (ATR Value × Multiplier).
Before going live, backtest your strategy across different market conditions. Pay close attention to how your ATR multiplier performs during volatile times, such as the 2020 market spike, as well as during calmer periods like July 2021. If you're using platforms like Traders, take advantage of simulated accounts to compare static sizing with volatility-adjusted sizing. This will help you identify which method delivers a smoother equity curve. Additionally, Traders offers educational tools like video courses and a supportive Discord community to help you refine your approach.
Once you've successfully tested and fine-tuned your strategy, you can confidently implement it in live markets with a systematic plan.
FAQs
What ATR period should I use for my trading style?
The default ATR (Average True Range) period is 14, which suits a variety of trading approaches, including day trading and swing trading. That said, some traders tweak this setting depending on their trading timeframe and the market's behavior. For shorter timeframes, 14 often performs well. But if you're focusing on swing or long-term trading, using a longer period, like 20, can help smooth out volatility. It's worth experimenting to discover the setting that complements your trading style best.
How do I choose the right ATR multiplier for stops and sizing?
Selecting the right ATR multiplier is all about finding the sweet spot between managing risk and accounting for market volatility. A commonly used range is 2x to 3x the ATR, as it strikes a balance between minimizing risk and maximizing reward.
Using a higher multiplier means setting wider stop-loss levels. This can help you avoid getting stopped out too early during normal market fluctuations, but it also means you’ll likely need to reduce your position size to manage overall risk. On the other hand, a lower multiplier results in tighter stops, which might expose you to more frequent stop-outs due to minor price movements (also known as whipsaws).
The best approach? Match your ATR multiplier to your personal trading style and the specific conditions of the market you're trading in. This ensures your risk management strategy stays effective and aligned with your goals.
How can I cap total portfolio risk when multiple trades are open?
To manage portfolio risk when juggling multiple open trades, consider using volatility-based position sizing. This approach tailors your trade sizes to market volatility, often relying on tools like the Average True Range (ATR). By reducing position sizes during periods of high volatility, you can better manage potential losses. Another smart strategy is dynamic sizing, where trade sizes are calculated as a percentage of your portfolio. This helps maintain consistent risk levels and keeps your overall exposure under control.
Related Blog Posts
Start Trading with For Traders
Join our platform to test your trading skills, trade virtual capital, and earn real profits. Access educational resources, advanced tools, and a supportive community to enhance your trading journey.
Start your Trading Challenge