7 Tips To Avoid Overfitting in Trading Rules
Avoid overfitting in trading strategies: simplify rules, limit parameter tuning, use out-of-sample and walk‑forward tests, sensitivity and cross‑market checks.
When a trading strategy performs well during backtesting but fails in live markets, overfitting is often the problem. Overfitting occurs when a strategy is too tailored to historical data, mistaking random noise for genuine market signals. This leads to unreliable performance and financial losses. Below are 7 practical tips to help you design strategies that work better in live trading:
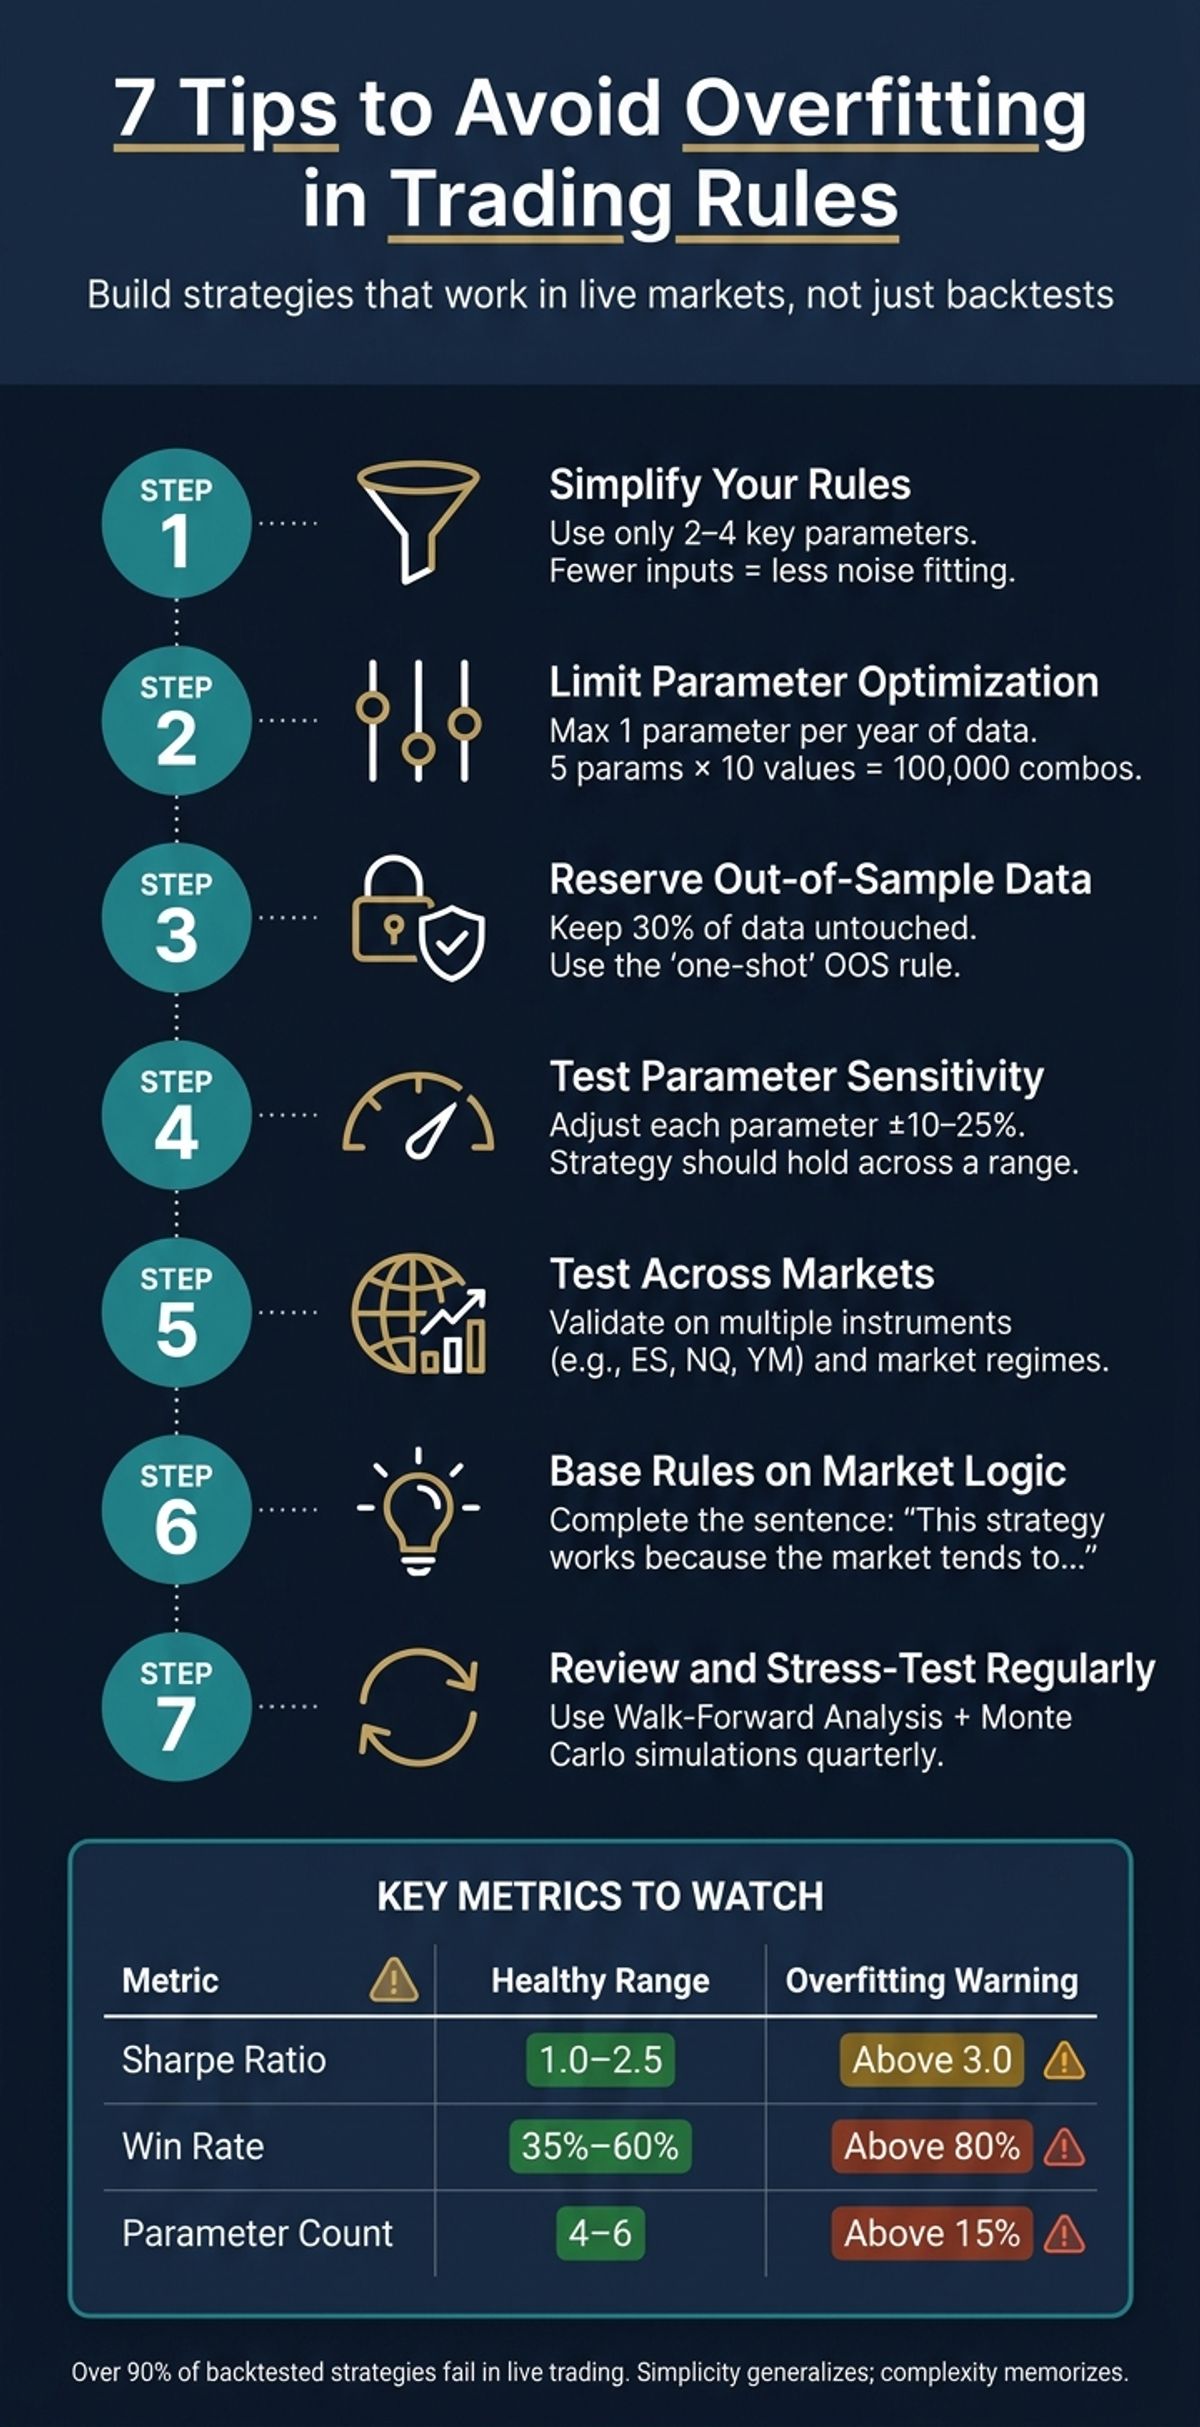
- Simplify Your Rules: Use fewer parameters (2–4 key inputs). Overly complex strategies often fail outside of backtests.
- Limit Parameter Optimization: Focus on key variables and avoid testing too many combinations, which increases the risk of overfitting.
- Use Out-of-Sample (OOS) Testing: Reserve 30% of your data for final validation and avoid reusing it during development.
- Check Parameter Sensitivity: Ensure your strategy performs well across a range of parameter values, not just one specific setting.
- Test Across Markets: Validate your rules on different instruments and market conditions to confirm consistency.
- Base Rules on Market Logic: Build strategies around logical, explainable market behaviors, not random patterns.
- Regularly Review and Stress-Test: Use tools like Walk-Forward Analysis and Monte Carlo simulations to evaluate long-term viability.
Key Metrics to Watch:
- Sharpe Ratio: Avoid strategies with unrealistically high values (e.g., above 3.0).
- Win Rate: Anything over 80% may signal overfitting.
- Parameter Count: Keep it below 5 to reduce noise fitting.
4.1) Practical Steps to avoid Over-Fitting | Algorithmic Backtesting & Optimization for Alphas
What Is Overfitting in Trading Rules?
Overfitting happens when a trading strategy is designed too specifically around historical data, picking up on random noise instead of actual market patterns. This can make the strategy look impressive in backtests but unreliable when applied to future markets. Let’s break down what overfitting involves and why it’s a problem.
The core issue lies in distinguishing between signal and noise. A signal represents consistent market behaviors tied to trader actions, while noise is just random fluctuations in historical data. Overfitted strategies fail to separate the two, which is what makes them risky.
One of the main culprits behind overfitting is parameter mining - testing countless parameter combinations to find one that appears profitable. The math doesn’t lie: if you test 45 strategy variations on five years of daily data, the chances of overfitting exceed 50%. Worse, running 50 independent tests at a 5% significance level almost guarantees (92.3% likelihood) at least one "significant" result purely due to chance. As VARRD Inc. explains:
"If you test 50 parameter variations and pick the best one, there is a near-mathematical certainty that your 'edge' is an artifact of randomness."
An overfitted strategy might shine during simulations by exploiting quirks in historical data, but it typically fails in real-world trading. A smooth and profitable backtest equity curve may seem appealing, but it often signals overfitting rather than genuine performance.
Understanding these warning signs is crucial before fine-tuning any trading strategy. It’s better to aim for robust, adaptable rules than to chase perfection in backtests.
1. Keep Your Rule Sets Simple and Clear
Simplifying your trading rules is one of the best ways to avoid overfitting. By reducing the number of parameters, you lower the risk of capturing random noise in the data. A strategy that relies on just 2–4 key inputs is much more likely to succeed in live markets than one with 8–10 variables tailored to a specific historical dataset. Complexity often leads to overfitting, so keeping things simple gives your strategy a sharper and more reliable edge.
Clear and straightforward rules also help you identify weaknesses more easily. If your strategy starts underperforming, having transparent rules allows you to determine whether the market conditions have changed or if the strategy itself is flawed. With overly complicated systems, diagnosing the issue becomes almost impossible.
Here’s a quick gut-check: can you describe why your strategy works in one sentence? For example, "This strategy works because the market tends to..." If you can’t complete that sentence with a clear, logical explanation, your strategy might just be a collection of filters rather than a true edge. As SetupAlpha wisely advises:
"If you can't explain why a strategy works in one sentence, don't trade it."
Another tip is to use round numbers for your parameters. Common settings like a 14-period RSI or a 50-period EMA are rooted in widely observed market behaviors. If slightly adjusting a parameter causes your strategy to stop working, it’s probably tuned to noise rather than a genuine pattern. A robust strategy should perform well across a range of parameter values.
When deciding between a simple and a more complex version of a strategy, always test them on out-of-sample data. If the complex version doesn’t significantly outperform the simpler one in these tests, stick with the simpler approach. A streamlined rule set not only reduces risk but also creates a strong foundation for refining parameters further.
2. Limit Parameter Optimization to Key Inputs
Adding too many parameters to your trading strategy can weaken it. Why? Because every extra variable you optimize increases the number of combinations your backtest has to evaluate. For example, two parameters with 10 possible values each result in 100 combinations. But bump that up to five parameters, and you're suddenly dealing with 100,000 combinations. This creates a problem: testing 1,000 parameter combinations over three years of data gives you a 95% chance of stumbling on a false positive. In other words, you're not building a strategy - you're just getting lucky with your backtest.
"Optimizing more parameters than years of data almost guarantees overfitting. With 5 years of daily data, optimize a maximum of 3–4 parameters." - James Mitchell, Trading Systems Developer, StratBase.ai
Here’s a good rule to follow: limit optimization to one parameter per year of historical data. If you’re working with five years of daily data, aim to optimize no more than 3–4 parameters. Focus on the variables that truly impact your strategy, such as your core indicator period (like the length of an EMA or the lookback for RSI), entry/exit thresholds, and risk management settings (e.g., an ATR-based stop loss).
One common mistake is piling on indicators that essentially measure the same thing. For instance, combining RSI and Stochastic might seem like you're adding confirmation, but since both measure momentum, you're not introducing any new information. Instead, try pairing indicators that capture different aspects of the market. For example, use a trend filter alongside a volatility measure for a more balanced approach.
When optimizing, aim for the middle of a performance plateau - a range where nearby parameter values produce similar results. If a small tweak (say, 10–20%) drastically changes performance, that’s a red flag you’re tuning to noise rather than a genuine signal.
"The best parameter set is rarely the optimal one - it's the one that performs consistently well across multiple market environments, even if it's never the absolute best in any single period." - Sarah Chen, Quantitative Researcher, StratBase.ai
3. Reserve Out-of-Sample Data and Test Forward
Once you've refined and narrowed down your parameters, it's time to validate those rules against fresh data to see how well they hold up. Here's the approach: take 70% of your data as the in-sample (IS) training set for optimization, and set aside the remaining 30% as your out-of-sample (OOS) "final exam." This reserved data is critical - it acts as a benchmark for how your strategy might perform in real-world conditions. But remember, don’t touch the OOS data during development.
Stick to the "one-shot" rule: you get one chance to run your OOS test. If you adjust your strategy after seeing poor OOS results and test again, that data is no longer truly out-of-sample - it’s now part of your training set. As Sarah Chen, a quantitative researcher at StratBase.AI, wisely put it:
"In God we trust. All others must bring data - out-of-sample data." - Sarah Chen, Quantitative Researcher, StratBase.AI
Measuring Performance with Walk-Forward Efficiency (WFE)
To evaluate your strategy's robustness, use Walk-Forward Efficiency (WFE): (OOS Net Profit ÷ IS Net Profit) × 100
Here’s how to interpret the results:
A WFE above 70% is a good indicator that your strategy is sound, while anything below 30% suggests overfitting and calls for a rethink.
Using Walk-Forward Analysis (WFA)
Another key tool is Walk-Forward Analysis (WFA). This method involves repeatedly optimizing your strategy on one block of data and testing it on the next. This process mimics real-time performance across different market conditions - bullish, bearish, and sideways markets - rather than relying on a single optimized period. To ensure statistical reliability, make sure each OOS window contains at least 30 trades.
As noted by Trends and Breakouts:
"The OOS curve is the only one that matters for deciding whether to trade the strategy." - Trends and Breakouts
Ready to trade funded capital?
Choose your path — Instant Accounts, One-Step or Two-Step Challenges — from just $23, with up to $300,000 in funded capital.
Choose your challenge4. Test How Sensitive Your Parameters Are
Once you've confirmed your strategy performs well on out-of-sample data, it's time to evaluate how sensitive it is to parameter changes. Why? A strategy that only works with one exact setting - like an RSI set to precisely 14 - but fails at 12 or 16 is a major warning sign. That’s not a reliable edge; it might just be a fluke.
To check, adjust each parameter by ±10–25% of its original value. If the strategy still holds up within that range, you're likely working with a meaningful market signal. On the other hand, if even small tweaks cause performance to tank, the strategy is probably overfitted to historical data and not built to handle real-world variability.
"If only the exact optimal combination works and every neighbor is a loser - that's textbook overfitting." - James Mitchell, Trading Systems Developer
Visualizing sensitivity can make trends clearer. A heatmap is a great option: plot two parameters on a grid and look for broad "green zones" where multiple combinations remain profitable. A reliable strategy will show a wide plateau of profitability, while an overfitted one will look more like a sharp needle. Instead of picking the absolute peak, choose a value from the middle of a stable plateau. This gives you some breathing room when market conditions change.
One more thing to watch for: if a strategy only works with oddly specific values (like an RSI of 13.7 instead of 14), it’s probably exploiting random noise. Rounded inputs and a Parameter Stability Score above 70–80% are better indicators that your strategy reflects real market behavior.
5. Test Your Rules Across Different Markets and Conditions
Sensitivity testing can confirm if your parameters hold steady, but testing across multiple markets evaluates whether your logic is sound. For instance, if a strategy performs well on the E-mini S&P 500 (ES) but fails on the Nasdaq 100 (NQ) or Dow futures (YM), that's a warning sign. Cross-market testing complements sensitivity analysis by assessing whether your strategy's principles remain valid under varying conditions. Since these markets are closely correlated, a real edge should appear consistently across all three.
"If a strategy works on one instrument but not on another, then we're probably not capturing a real edge. Instead, we've adapted our rules to a specific historical series." - Unger Academy
It's not just about similar instruments. Your strategy must also withstand different market regimes - bull markets, bear markets, sideways trends, and periods of extreme volatility. A strategy that only excels in a trending bull market isn't resilient; it's simply benefiting from favorable conditions. To test thoroughly, ensure your historical data includes major market disruptions like the 2008 financial crisis or the 2020 COVID-19 crash. These stress periods reveal vulnerabilities that might otherwise go unnoticed.
Set aside a high-volatility year as a dedicated holdout set - a segment of data untouched during optimization. Use this as a final test before deploying the strategy in live trading. If the strategy performs well in this scenario, it provides stronger evidence of identifying a genuine market pattern. Keep in mind that over 90% of backtested strategies fail in live trading, and only a small fraction - around 1 in 20 ideas - survives full professional validation. Cross-market testing is a critical step in ensuring your strategy's performance isn't just a fluke.
Here's a quick breakdown of core test types, their purpose, and potential red flags:
To quantify robustness, calculate the Walk-Forward Efficiency (WFE) ratio by dividing the annualized out-of-sample return by the annualized in-sample return. A WFE ratio between 50% and 85% in cross-market tests suggests a legitimate edge. However, if the ratio falls below 35%, it likely indicates curve-fitting.
6. Base Your Rules on Market Logic and Risk Limits
Empirical tests can confirm performance, but building your rules around clear market logic and defined risk limits ensures your strategy holds up when market conditions shift.
Try the One-Sentence Test: complete the thought - "This strategy works because the market tends to..." - with a specific and believable market behavior. If you can’t, your rules might be overfitted or unnecessarily complicated.
"If you can explain your strategy in one sentence, you understand what it's exploiting. And if you know what it's exploiting, you know when that edge is gone." - SetupAlpha
Logic-driven rules also make troubleshooting easier. For instance, if a trend-following strategy starts lagging, you can ask, "Is the market just choppy right now?" On the other hand, a purely data-mined rule offers no clear explanation for its failure. Pairing logical rules with clear risk limits makes your strategy more resilient.
Risk limits follow the same philosophy. Simple, rounded constraints - like a 2% stop loss or a 20-period EMA - are sturdier than overly specific ones. If your strategy only works with an RSI threshold of 27.4 instead of 30, that’s a warning sign, not a meaningful improvement. Adding too many parameters increases the chances of overfitting.
Here’s a quick look at how adding conditions and parameters raises the risk of overfitting:
7. Use Structured Evaluation Tools and Review Rules Regularly
To keep your trading strategies sharp and effective, structured evaluations are essential. Even well-tested strategies can veer into overfitting after small adjustments. Tools like Walk-Forward Analysis (WFA) and Monte Carlo simulations can extend your testing beyond basic backtests. WFA applies optimization across rolling time windows, mimicking how a strategy would be re-optimized in live trading scenarios. Meanwhile, Monte Carlo simulations stress-test your rules by running thousands of scenarios. If your live drawdown surpasses the 95th percentile in these simulations, it could signal that your strategy's edge is fading. These methods work alongside sensitivity and cross-market tests to create a more comprehensive evaluation process.
These evaluations also help you determine whether your strategy operates on a parameter plateau or a parameter island. If your strategy is on a plateau, it means neighboring settings yield similar results, indicating stability. On the other hand, if it’s on an island - where one specific setting outshines all others - it’s likely to fail in live trading. As Nayab Bhutta wisely notes:
"A mediocre model that generalizes is far more valuable than a brilliant model that memorizes history."
To stay ahead, consider conducting quarterly reviews. These reviews can help you monitor your strategy's out-of-sample Sharpe ratio. A drop of more than 50% compared to backtested results is often a red flag for overfitting. Additionally, keep an eye on metrics like profit factor, win rate, and drawdown using the benchmarks below:
(Source: Algo Studio)
One critical yet often overlooked safeguard is setting pre-defined stop criteria before going live. For example, you might decide to pause a strategy if its current drawdown exceeds twice the backtested baseline. This proactive approach eliminates emotional decision-making and ensures you stick to a disciplined trading process.
Conclusion
Overfitting often causes strategies that shine in backtests to stumble in live markets. The seven tips outlined here form a cohesive system to address this challenge. Keeping strategies simple and limiting parameters (Tips 1 and 2) reduces the chances of overfitting to random noise. Grounding your rules in market logic (Tip 6) ensures you're targeting genuine market behaviors. Meanwhile, reserving out-of-sample data (Tip 3) provides a reliable test before committing real funds. Sensitivity testing and cross-market validation (Tips 4 and 5) confirm that your strategy has a solid and broad edge. Finally, structured reviews (Tip 7) ensure your approach remains relevant and effective as market conditions change.
The value of these principles is backed by data. A May 2026 study by SetupAlpha compared two mean-reversion strategies on S&P 500 stocks from January 2000 to April 2026. The simpler strategy, with just four rules, showed an in-sample Sharpe ratio of 0.69, which improved to 1.18 out-of-sample (2019–2026). In contrast, a more complex 12-rule strategy had a higher in-sample Sharpe ratio of 0.93, but it plummeted to 0.50 out-of-sample - nearly halving its backtested performance. The simpler strategy’s win rate also rose from 67% to 76% in live-simulated trading, while the complex strategy's expectancy per trade dropped from 1.12% to 0.61%.
This highlights why building flexible and effective rules is essential. As Robert Pardo aptly said:
"A model with enough free parameters can fit any historical dataset, including one generated by random noise. The fit tells you nothing about what will happen next."
The ultimate goal is to create strategies that generalize - ones that perform consistently, whether in backtests, simulated environments, or live markets. Platforms like For Traders allow you to test this consistency through simulated trading, offering real profit potential without risking capital. By applying these seven tips together, you can design trading strategies that are built to endure, not just to look good on paper.
FAQs
How do I know if my backtest results are just luck?
To determine if your backtest results are based on luck, watch for signs of overfitting. These include metrics that seem too good to be true, noticeable differences between in-sample and out-of-sample performance, or strategies that only succeed during particular times or with specific instruments.
You can test robustness with tools like parameter sensitivity analysis or out-of-sample testing. Methods such as walk-forward analysis and Monte Carlo simulations are also useful for assessing whether your results are dependable or just coincidental.
What’s the safest way to split data for out-of-sample testing?
To ensure safe data splitting for out-of-sample testing, start by dividing historical data into two sets: in-sample (training) and out-of-sample (testing). A typical approach is to allocate 70% of the data for training and 30% for testing. It's crucial to optimize and refine strategies exclusively on the in-sample data. Once the strategy is finalized, test it just once on the out-of-sample data. This step helps maintain unbiased validation and minimizes the risk of overfitting.
How many trades do I need before trusting a strategy?
To build confidence in a trading strategy, aim for at least 50-100 trades per free parameter. For example, if your strategy uses 5 parameters, you should target 250-500 trades. This approach minimizes the risk of overfitting and ensures the results are more dependable.
Ready to trade funded capital?
Choose your path — Instant Accounts, One-Step or Two-Step Challenges — from just $23, with up to $300,000 in funded capital.
Choose your challengeTrade up to $300,000
Choose challenge