

Backtesting stop-loss and take-profit levels is essential for traders to refine their strategies and manage risk effectively. It helps you determine how these levels would have performed in past market conditions, providing data-driven insights to improve profitability and avoid costly mistakes. Here's a quick breakdown:
- Stop-Loss: Limits potential losses by closing a trade when the market moves against you.
- Take-Profit: Locks in gains by exiting a trade when a predefined profit target is reached.
- Why Backtest?: It removes guesswork, evaluates historical performance, and identifies strategies with a mathematical edge before risking actual money.
Key steps include:
- Choose a Platform: Options like TradingView (user-friendly), MetaTrader 5 (forex-focused), or Python with Backtrader (customizable).
- Set Parameters: Define clear stop-loss and take-profit rules, such as fixed percentages or volatility-based levels like ATR.
- Use Quality Data: Ensure clean, accurate historical data for reliable results. Cover multiple market conditions for robustness.
- Manual vs. Automated Testing: Manual testing builds intuition but is time-intensive; automated tools like Python or MetaTrader save time and offer precision.
- Analyze Results: Focus on metrics like profit factor, expectancy, win rate, and drawdown to evaluate strategy performance.
Backtesting isn’t about predicting the future - it’s about avoiding mistakes and improving decision-making. Always validate strategies on out-of-sample data and test them in demo accounts or funded accounts before live trading.
Stop Losses in Backtesting.py

Setting Up a Backtesting Framework
Backtesting takes trading strategies from theory to actionable insights. To get reliable results, you’ll need a solid setup: the right tools, clear parameters, and clean data. Skipping any of these steps can weaken your strategy’s foundation.
Choosing a Backtesting Platform
The platform you choose depends on your technical expertise and the type of strategy you’re testing. Here are some popular options:
- TradingView: Known for its user-friendly interface and Pine Script, it’s perfect for visualizing strategies directly on charts. It’s a great choice for retail traders, with plans starting at $12.95/month and a free tier for basic testing.
- MetaTrader 5: Ideal for forex and CFD traders, this platform offers tick-level precision and uses MQL5 for scripting.
- Python with Backtrader: For developers, this framework allows maximum customization, enabling complex logic and tailored data handling.
A notable example comes from January 2023, when trader Nate B tested a Moving Average Crossover strategy on the SPY ticker using Backtrader. Starting with $100,000 on January 1, 2022, the strategy executed six trades over the year, ending with a $978.24 net profit. This outperformed a buy-and-hold approach, which would have resulted in a 20% loss - approximately $19,945.15 - during the same period.
When selecting a platform, ensure it supports bracket orders, allowing you to set entry, stop-loss, and take-profit orders simultaneously. Additionally, the platform should account for trading costs like commissions, spreads, and slippage. Incorporating 1–2 ticks or pips of slippage helps mimic real-world execution and provides more accurate profit estimates.
Defining Stop-Loss and Take-Profit Parameters
Stop-loss and take-profit levels are critical for managing risk. These parameters should align with your trading goals and the characteristics of the asset you’re trading. Stops can be based on fixed prices, currency values, percentages, or even volatility indicators like the Average True Range (ATR). ATR-based stops adjust to market conditions, tightening during low volatility and widening during high volatility.
A common approach is to set stop-losses at 1.5x to 3x the asset’s ATR. This helps avoid being stopped out by normal price fluctuations while maintaining control over risk. The reward-to-risk ratio also plays a key role. For range-trading strategies, a conservative 1:1 ratio works but requires a win rate above 50%. Trend-following strategies, on the other hand, often use a 2:1 ratio, which remains profitable with a win rate as low as 35%.
For more advanced setups, consider the Triple-Barrier Method, which uses three exit points: a profit-taking barrier, a stop-loss barrier, and a time barrier. This approach prevents capital from being tied up in non-performing trades. For strategies with a 30% win rate, a minimum risk-to-reward ratio of 2.5:1 is necessary to achieve profitability.
Once you’ve defined these parameters, validating them with accurate historical data is the next step.
Preparing Historical Data
High-quality historical data is the backbone of any backtest. The resolution of your data should match your strategy. For example:
- Scalping: Requires tick-by-tick or minute-level data.
- Swing trading: Typically uses daily or weekly OHLCV (Open, High, Low, Close, Volume) data.
To ensure your strategy holds up across different market conditions, aim for at least 2–3 years of data for intraday strategies and 10–15 years for swing trading. Use the 70/30 split method: develop your strategy with 70% of the data and validate it on the remaining 30% as an out-of-sample test. This helps avoid overfitting.
Check your data for issues like missing candles or incorrect values, as these can lead to false signals in indicators like RSI or moving averages. For equity testing, adjust for stock splits and dividends to avoid artificial price gaps. Including data for delisted companies can also help reduce survivorship bias.
Your test period should cover a variety of market conditions - bull markets, bear markets, and periods of sideways movement. Incorporate major historical events like the 2008 Financial Crisis, the 2020 COVID-19 crash, and the 2022 bear market to see how your strategy handles extreme volatility. Lastly, ensure your backtest includes at least 100 trades for statistical reliability; anything under 30–50 trades is generally insufficient.
Manual Backtesting: Step-by-Step Process
Manual backtesting might take more time than automated methods, but it sharpens your ability to spot patterns and builds confidence when trading with real money. The key is to avoid hindsight bias and meticulously log every trade that meets your criteria.
Identifying Trades from Historical Charts
Before diving into charts, write down your trading rules. Gary M., Founder of TSB, emphasizes:
"If you cannot write your strategy in a way that a stranger could execute it without asking a single question, your rules are not specific enough."
Your stop-loss and take-profit rules should be precise and repeatable. For instance, instead of saying, "place stop below support", specify something like, "place stop 5 pips below the 21 EMA" or "set stop at 2x ATR below entry." This clarity removes guesswork and prevents bias when reviewing trades.
Platforms like TradingView offer Bar Replay features, allowing you to move through historical data one candle at a time. This hides future price movements, forcing you to make decisions as if you were trading live. As you advance one bar at a time, decide if your rules signal an entry. Log the trade without peeking at subsequent price action. Place your stop-loss at the nearest invalidation point, such as a swing low or resistance level, and set take-profit levels based on historical support/resistance zones or a fixed risk-to-reward ratio like 1:2.
For volatility-based strategies, calculate the ATR at the entry point and set your stop at 1.5–3× ATR. This method adapts to market conditions rather than relying on fixed percentages. Stock traders might use the "7% rule", placing stops 7% to 8% below the purchase price as a simple starting point.
Once you identify a trade, document it thoroughly to evaluate the effectiveness of your strategy.
Recording and Analyzing Results
After identifying trades, organize your findings systematically. Log every trade that meets your criteria, including the date/time, direction, entry, stop-loss, take-profit, and outcome. Also, calculate the R-multiple for each trade - the ratio of reward to initial risk. For example, if you risk $100 to make $200, the trade yields a +2R result.
Gary M. advises testing a minimum of 100 trades to achieve statistical significance, as fewer than 30 trades often result in unreliable data. Use the following formula to calculate your strategy's expectancy:
(Win Rate × Average Win) − (Loss Rate × Average Loss)
A positive result indicates your strategy has an edge. Additionally, your Profit Factor (total gross profit divided by total gross loss) should be above 1.5, and a Sharpe Ratio over 1.0 suggests strong risk-adjusted returns.
Don’t forget to account for commissions, spreads, and slippage. These costs can turn a seemingly profitable strategy into a losing one when traded live. Also, track your maximum drawdown - the largest drop in your equity curve from a peak to a trough. For example, if your backtest shows a 15% drawdown, ensure your live risk management plan can handle that level comfortably.
As the TradeZella Team wisely points out:
"A strategy that loses money over 500 backtested trades isn't suddenly going to work when you trade it live."
Automated Backtesting Methods
Backtesting Platform Comparison: Features, Speed, and Best Use Cases
Automated backtesting takes the manual process to the next level, offering speed and precision when testing stop-loss and take-profit strategies. While setting up an automated system requires some initial effort, it allows you to run countless variations of your rules in a fraction of the time. Here’s a closer look at how automation can streamline your strategy evaluation.
Using Trading Platforms for Automated Backtesting
NinjaTrader 8 provides a Strategy Analyzer tool that runs custom NinjaScript strategies on historical data. You can tweak settings like "Historical fill processing" for order resolution and add "Slippage" parameters to mimic real-market conditions. For those who don’t need intraday data, NinjaTrader includes a free "Kinetick" end-of-day data connection.
TradingView uses Pine Script to create automated strategies. These strategies go beyond indicators by executing trades and managing positions. You can configure settings such as initial capital, commission (e.g., 0.1%), and slippage in the "Properties" tab for more realistic simulations. Starting at around $15/month, TradingView’s Basic plan offers more charts, alerts, and Pine Script features. However, the free tier limits you to about 10,000 bars of historical data, which may restrict long-term backtesting.
MetaTrader 5 (MT5) is a favorite for Forex and CFD traders, offering tick-by-tick simulations for high precision. It supports advanced features like optimization and walk-forward testing, which divides data into segments to simulate real-time adaptability.
For those who prefer no-code options, Backtrex allows users to build strategies visually by dragging and dropping indicator and condition blocks. It’s beginner-friendly and offers a free account setup without requiring a credit card.
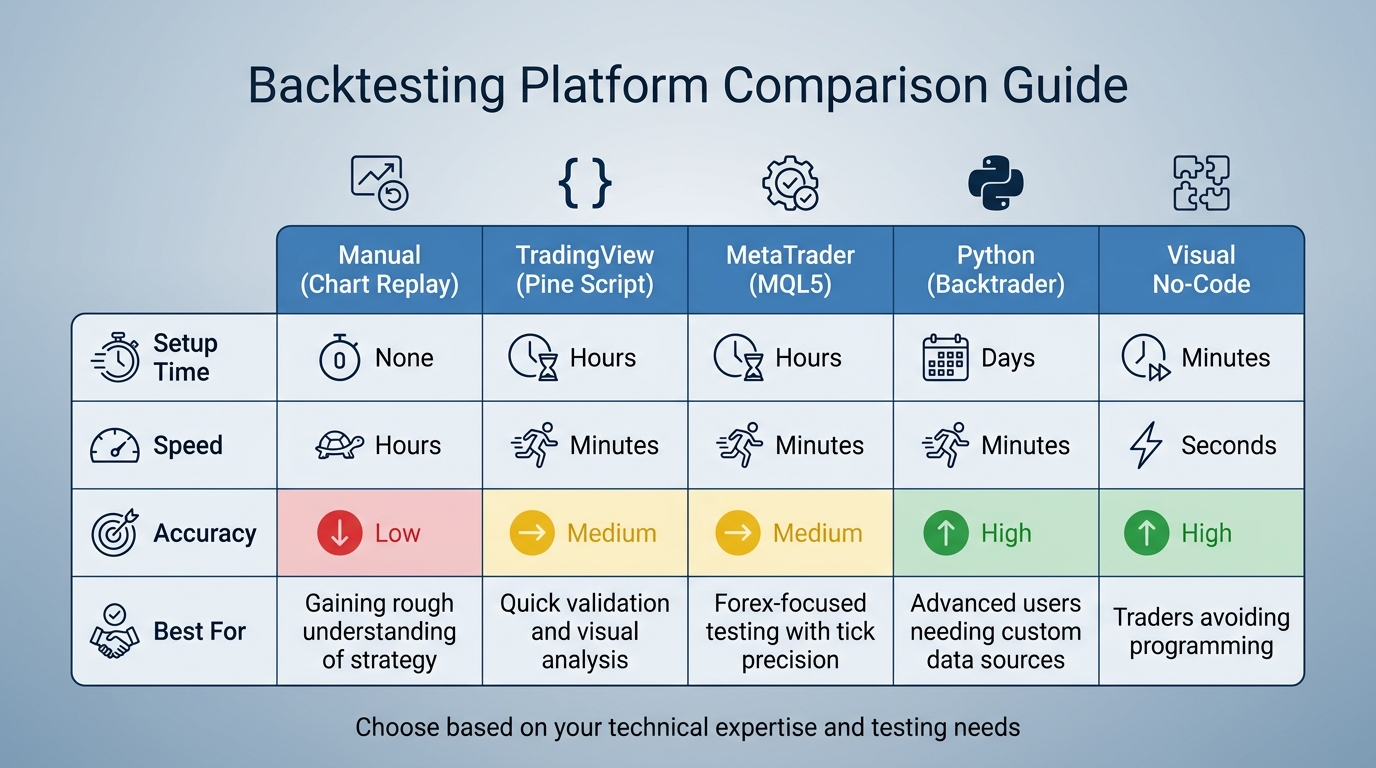
| Method | Setup Time | Speed | Accuracy | Best For |
|---|---|---|---|---|
| Manual (Chart Replay) | None | Hours | Low | Gaining a rough understanding of a strategy |
| TradingView (Pine Script) | Hours | Minutes | Medium | Quick validation and visual analysis |
| MetaTrader (MQL5) | Hours | Minutes | Medium | Forex-focused testing with tick precision |
| Python (Backtrader) | Days | Minutes | High | Advanced users needing custom data sources |
| Visual No-Code | Minutes | Seconds | High | Traders avoiding programming |
When running simulations, always account for realistic costs. For instance, a strategy yielding a 0.1% return per trade may turn unprofitable after factoring in a 0.05% spread and a 0.02% commission. Use granular data, like M1 (1-minute) intervals, even for higher timeframes. This helps capture intrabar price movements that might trigger stop-losses before reaching targets.
If you’re comfortable with coding, Python offers a flexible alternative to platform-based backtesting.
Backtesting with Python
Python libraries such as Backtrader, backtesting.py, bt, and VectorBT provide robust tools for testing strategies. Backtrader stands out for its versatility, featuring over 122 built-in indicators, making it ideal for complex strategies. backtesting.py is lightweight and fast, with interactive Bokeh charts, which makes it beginner-friendly. VectorBT, optimized with Numba and NumPy, is designed for high-frequency testing on massive datasets.
Typically, historical data is loaded into a Pandas DataFrame with OHLCV (Open, High, Low, Close, Volume) series. Strategies are defined in a class that extends the library's base strategy class. For example, in Backtrader, indicators are initialized in the __init__ method, while entry and exit logic is handled in the next() method.
To automate stop-loss and take-profit levels efficiently, use bracket orders. In Backtrader, the self.buy_bracket(limitprice=TP_price, stopprice=SL_price) function submits an entry order with linked stop-loss and take-profit levels. Similarly, backtesting.py offers self.buy(sl=SL_price, tp=TP_price) for the same purpose. These One-Cancels-the-Other (OCO) orders ensure that when one level is hit, the other is automatically canceled.
To avoid overfitting, validate optimized parameters on "out-of-sample" data - data not used during development. Split your historical data into a "Development Set" (first 70%) for refining rules and a "Testing Set" (remaining 30%) for validation. As Pham The Anh cautions:
"Bad data silently kills strategies. Before you backtest or push anything to production, normalize schemas, fix timezones, de-duplicate, validate OHLCV, handle missing data deliberately, detect and cap outliers."
For meaningful results, aim for at least 200 trades, though 500+ trades offer greater confidence. A profit factor between 1.3 and 1.8 is considered solid, while anything above 2.0 might indicate overfitting. Similarly, a Sharpe Ratio above 1.0 is acceptable, above 2.0 is strong, and above 3.0 should be carefully scrutinized for potential overfitting.
Interpreting and Applying Backtest Results
Evaluating Performance Metrics
Once your backtest is complete, it's time to dig into the numbers. Start with expectancy, which Quant Signals highlights as the most critical metric:
"Expectancy is the average profit or loss per trade, measured in R (risk units). It's the single most important metric because it tells you directly whether a strategy makes money over time."
If expectancy is negative, your strategy lacks a profitable edge. Next up is the profit factor, calculated by dividing gross profit by gross loss. A profit factor below 1.0 means you're losing money. Professional strategies generally fall between 1.3 and 1.8, while anything over 2.0 might suggest overfitting. A long-term profit factor of 1.6 is often more reliable than a short-term spike to 2.5.
Context is everything when interpreting win rates. A 30% win rate can still be profitable if your take-profit is 2.5 times your stop-loss, while a 70% win rate only needs a 0.4:1 ratio. For example, Quant Signals tested the EMA Crossover (9/21) strategy on BTCUSD daily charts from 2020 to 2025. With 88 trades, it achieved a 44.3% win rate but maintained a profit factor of 1.59 and a positive expectancy of +0.330R per trade.
Maximum drawdown is another crucial measure - it shows the steepest equity decline in your backtest. Expect real-world drawdowns to be about 1.5× your historical maximum, so adjust position sizes accordingly. Ideally, keep drawdown under 20%; anything over 30% is risky territory. Lastly, assess the Sharpe Ratio for risk-adjusted returns. Scores above 1.0 are acceptable, above 2.0 are strong, and anything over 3.0 could indicate overfitting.
| Win Rate | Minimum R:R for Profit |
|---|---|
| 30% | 2.5:1 |
| 40% | 1.5:1 |
| 50% | 1:1 |
| 60% | 0.7:1 |
| 70% | 0.4:1 |
Use these metrics to pinpoint areas for improvement and refine your strategy for better results.
Adjusting Strategies Based on Backtest Data
Armed with your performance metrics, it's time to tweak your strategy. Start by adjusting stop-loss and take-profit levels to optimize risk-reward dynamics. If your drawdown is too high, your stop-loss might be too loose. For instance, one study found that tightening a stop-loss from 8% to 5% improved the risk-reward ratio from 1:1.5 to 1:2.3 over a decade. Make sure to change only one parameter at a time and limit your focus to 3-5 parameters to avoid overfitting.
Run sensitivity tests to ensure robustness. If your take-profit ratio is optimized at 2:1, test it at 1.5:1 and 2.5:1 as well. A strong strategy should perform well across a range of values, not just one "perfect" setting. Always validate these refinements on the 30% of historical data you didn’t use during development. If adjustments work on the initial 70% but fail on the remaining 30%, your strategy may be overfit to noise.
Consider this: In a test of 64 backtests, only 48% of strategy-asset-timeframe combinations showed positive expectancy. Many popular methods simply don’t hold up under scrutiny. For example, the London Breakout strategy on GBPUSD led to a catastrophic 133.5% drawdown - enough to wipe out an account.
Before committing real money, stress-test your strategy with realistic costs. Factor in spreads, commissions, and slippage. Strategies with tight stop-loss levels often appear profitable until these costs erode their edge. Check for profit concentration too - if removing your single best trade makes the strategy unprofitable, your take-profit levels may not be reliable. Finally, validate your adjustments through 1-6 months of paper trading. Be prepared for performance to drop by 15%-30% due to real-world factors like execution delays and slippage. This step ensures your refined strategy can handle live market conditions effectively.
Using For Traders for Backtesting and Strategy Development

Once you've fine-tuned your stop-loss and take-profit strategies through backtesting, the next step is to test them in an environment that closely resembles live trading - without putting your actual capital at risk.
Simulated Trading Challenges
Armed with solid backtesting results, you can put your strategies to the test in a realistic simulation. For Traders offers simulated trading challenges where you can use virtual capital ranging from $6,000 to $100,000. These demo accounts are designed to replicate real market conditions, allowing you to see how your strategies hold up when faced with execution challenges typical of live trading.
The platform also lets you customize trading rules, including setting your own stop-loss and take-profit levels within the challenge framework. A 5% maximum drawdown rule applies across all plans, helping you quickly identify if your stop-loss levels are too loose or if your position sizing needs tweaking. With no time restrictions, you can take the time you need to thoroughly evaluate your approach. Plus, bi-weekly payouts provide timely insights into whether your strategy is delivering consistent results.
Educational Resources and Community Support
For Traders includes access to over 12 video trading courses with every plan. These courses cover essential topics like strategy development and risk management rules, helping you grasp the reasoning behind effective stop-loss and take-profit setups before diving into testing.
Additionally, the platform's Discord community offers daily opportunities to engage with fellow traders. This space allows you to refine your strategies with input from others, gain real-time feedback, and explore different approaches. This mix of structured education and peer collaboration can help you identify whether discrepancies between your backtesting outcomes and simulated trading results are due to execution issues, psychological factors, or the need for parameter adjustments. The ongoing feedback loop ensures your strategies evolve based on both theoretical insights and practical experiences.
AI-Driven Risk Management Tools
For Traders also features AI-powered risk management tools that actively monitor your trades. These tools provide real-time alerts on your stop-loss and take-profit performance, offering insights that complement your backtesting data. By analyzing your trading patterns, they bridge the gap between theoretical strategy and actual execution.
When combined with advanced trading platforms like DXTrade, TradeLocker, and cTrader, For Traders delivers institutional-grade execution capabilities. This setup minimizes the disconnect between your backtested expectations and how your strategies perform in practice, giving you a clearer path to success.
Conclusion
Benefits of Backtesting
Backtesting stop-loss and take-profit strategies transforms trading into a disciplined, data-driven process. Instead of relying on gut feelings, it provides statistical evidence to evaluate your strategy's performance across various trades and market conditions. For instance, a detailed analysis of 64 backtests involving seven common strategies showed that only 48% resulted in a positive expectancy.
The true advantage lies in identifying risks. Backtesting uncovers key metrics like maximum drawdown - the steepest decline you might encounter - and helps detect potential weaknesses in your approach before they lead to real losses. Additionally, it often reveals how flexible stop-loss techniques can improve risk-adjusted returns. These insights enable you to fine-tune your exit parameters, such as modifying your risk-reward ratio or experimenting with alternatives like trailing stops.
"Backtesting is not a way to predict the future. It is a way to prevent obvious mistakes." - Finaur
Start Backtesting Your Strategies
If you're ready to start backtesting, here’s how you can move forward. Begin by defining clear, rule-based guidelines for your strategy. Use at least three to five years of historical data that captures a variety of market conditions, and conduct a baseline test. To avoid overfitting, set aside a portion of your data for final validation.
Before committing to live trading, forward test your refined strategy on a demo account for four to eight weeks. This step helps bridge the gap between theoretical backtesting results and actual market execution. Platforms like For Traders offer a great space for this final stage. They provide virtual capital up to $100,000, customizable trading rules, and AI-driven tools to monitor stop-loss and take-profit metrics in real time. With bi-weekly payouts and no time constraints, you can thoroughly evaluate whether your backtested strategy holds up under realistic trading scenarios.
FAQs
How do I choose between fixed and ATR-based stops?
Choosing between fixed stops and ATR-based stops comes down to your trading strategy and the current market environment. Fixed stops rely on a predetermined percentage or dollar amount, offering simplicity but requiring adjustments when market conditions shift. On the other hand, ATR-based stops adapt to market volatility by using the Average True Range (ATR) as a guide. These stops are often set at 1.5 to 2 times the ATR, making them more flexible and better suited for volatile markets. Each method has its strengths, so the choice depends on how dynamic you need your stop-loss strategy to be.
What’s the best way to avoid overfitting my stop-loss and take-profit levels?
To prevent overfitting when setting stop-loss and take-profit levels, consider using systematic optimization methods like grid search. This approach allows you to test various combinations of ATR (Average True Range) multiples systematically. However, before diving into optimization, ensure your trading strategy has a proven edge - fine-tuning flawed signals often results in disappointing outcomes.
It's also crucial to use rigorous backtesting techniques. Methods like walk-forward validation help evaluate performance over different market conditions, making your results more reliable. Finally, steer clear of data snooping, as overanalyzing historical data can lead to misleading conclusions and undermine the robustness of your strategy.
How do I model slippage and commissions in my backtest?
To account for slippage and commissions in your backtest, incorporate models that mimic these expenses. For commissions, you can use fixed-rate or percentage-based models, depending on your broker's fee structure. For slippage, define practical parameters - typically around 0.75% to 1% - to mirror actual market conditions. Properly factoring in these costs helps your backtest results better reflect real-world trading. By keeping your cost assumptions realistic, you'll enhance the reliability of your analysis.
Related Blog Posts
Start Trading with For Traders
Join our platform to test your trading skills, trade virtual capital, and earn real profits. Access educational resources, advanced tools, and a supportive community to enhance your trading journey.
Start your Trading Challenge