
CPI (Consumer Price Index) data is a critical tool for traders, offering insights into inflation trends and market behavior. Released monthly, it directly impacts forex, crypto, and stock markets by influencing monetary policy decisions. Here's a quick summary of how traders can approach CPI data:
- Understand CPI Basics: CPI tracks price changes in a basket of goods, with Core CPI (excluding food and energy) being the key focus for central banks.
- Key Market Impacts: Higher-than-expected CPI often strengthens currencies but weakens risk assets like stocks and crypto. Lower readings usually have the opposite effect.
- Trading Strategies:
- Pre-Release Positioning: Use forecasts to anticipate market moves.
- Breakout Trading During Release: Wait for volatility to settle before acting.
- Post-Release Fading: Trade reversals if the market overreacts.
- Risk Management: Use wider stop-losses, smaller position sizes, and avoid over-leverage during volatile CPI events.
To succeed, practice these strategies in funded accounts or demo trading environments and focus on risk management. CPI trading is about timing, preparation, and understanding market reactions.
Understanding CPI Data and Release Schedules
CPI Release Schedule
The U.S. Bureau of Labor Statistics (BLS) releases the Consumer Price Index (CPI) data every month at 8:30 AM Eastern Time, usually on the 13th business day of the month. Each report covers price changes from the previous month. For example, the May 2026 CPI report will be published on June 10, 2026.
To stay updated, you can check the official schedule on the BLS website or through economic calendars like FRED. You can also subscribe to the BLS ICS calendar to sync release dates directly to your personal calendar.
Here are the remaining CPI release dates for 2026:
| Reference Month | Release Date | Release Time |
|---|---|---|
| April 2026 | May 12, 2026 | 08:30 AM ET |
| May 2026 | Jun. 10, 2026 | 08:30 AM ET |
| June 2026 | Jul. 14, 2026 | 08:30 AM ET |
| July 2026 | Aug. 12, 2026 | 08:30 AM ET |
| August 2026 | Sep. 11, 2026 | 08:30 AM ET |
| September 2026 | Oct. 14, 2026 | 08:30 AM ET |
| October 2026 | Nov. 10, 2026 | 08:30 AM ET |
| November 2026 | Dec. 10, 2026 | 08:30 AM ET |
Now that you know when CPI reports are released, let’s break down how to interpret the data.
Reading Key CPI Data Points
Knowing when the report comes out is just the first step - understanding the numbers inside is where the real value lies. CPI data plays a major role in shaping market movements, and certain figures carry more weight than others.
One of the most important metrics is Core CPI, which excludes volatile food and energy prices. This measure provides a clearer view of inflation trends and is closely monitored by the Federal Reserve when setting interest rates.
The report also includes Month-over-Month (MoM) and Year-over-Year (YoY) changes. MoM figures highlight short-term shifts, while YoY data reveal longer-term trends relative to the Fed’s 2% inflation target.
But here’s the kicker: markets react not to the raw CPI numbers but to how they compare with forecasts. For instance, if the YoY CPI comes in 0.1% higher than expected, it can push bond yields up and send stock indices lower almost immediately.
Another key detail is the CPI basket’s composition. Housing holds the largest weight, accounting for about 42% of the index. The data is collected from 75 urban areas, covering approximately 93% of the U.S. population. All price changes are measured relative to a base period of 1982–1984, which is set at 100.
How to Trade CPI Data like a PRO: Inflation EXPLAINED!
3 CPI Trading Strategies for Beginners
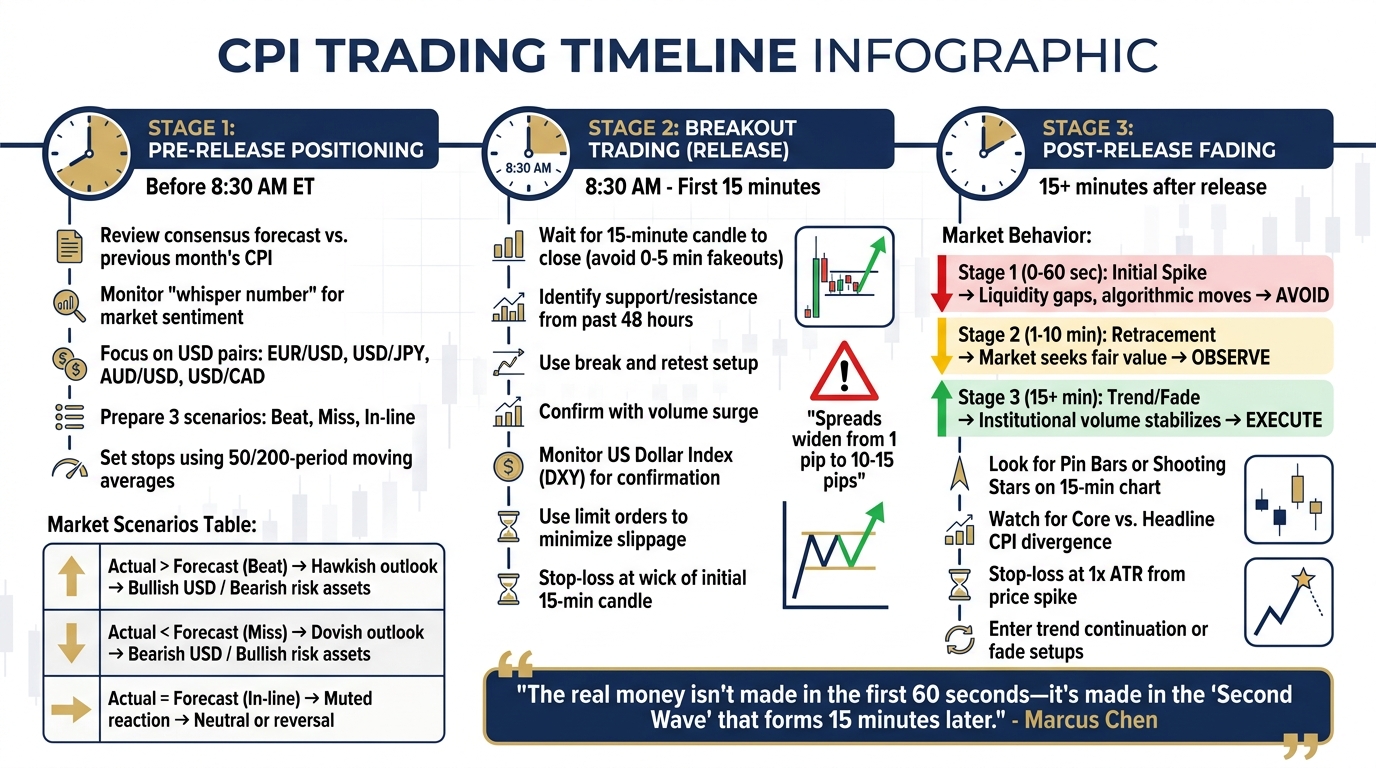
CPI Trading Timeline: 3-Stage Market Response Strategy
This section dives into three CPI trading strategies: pre-release positioning, breakout trading, and post-release fading.
Pre-Release Strategy: Trading Consensus Forecasts
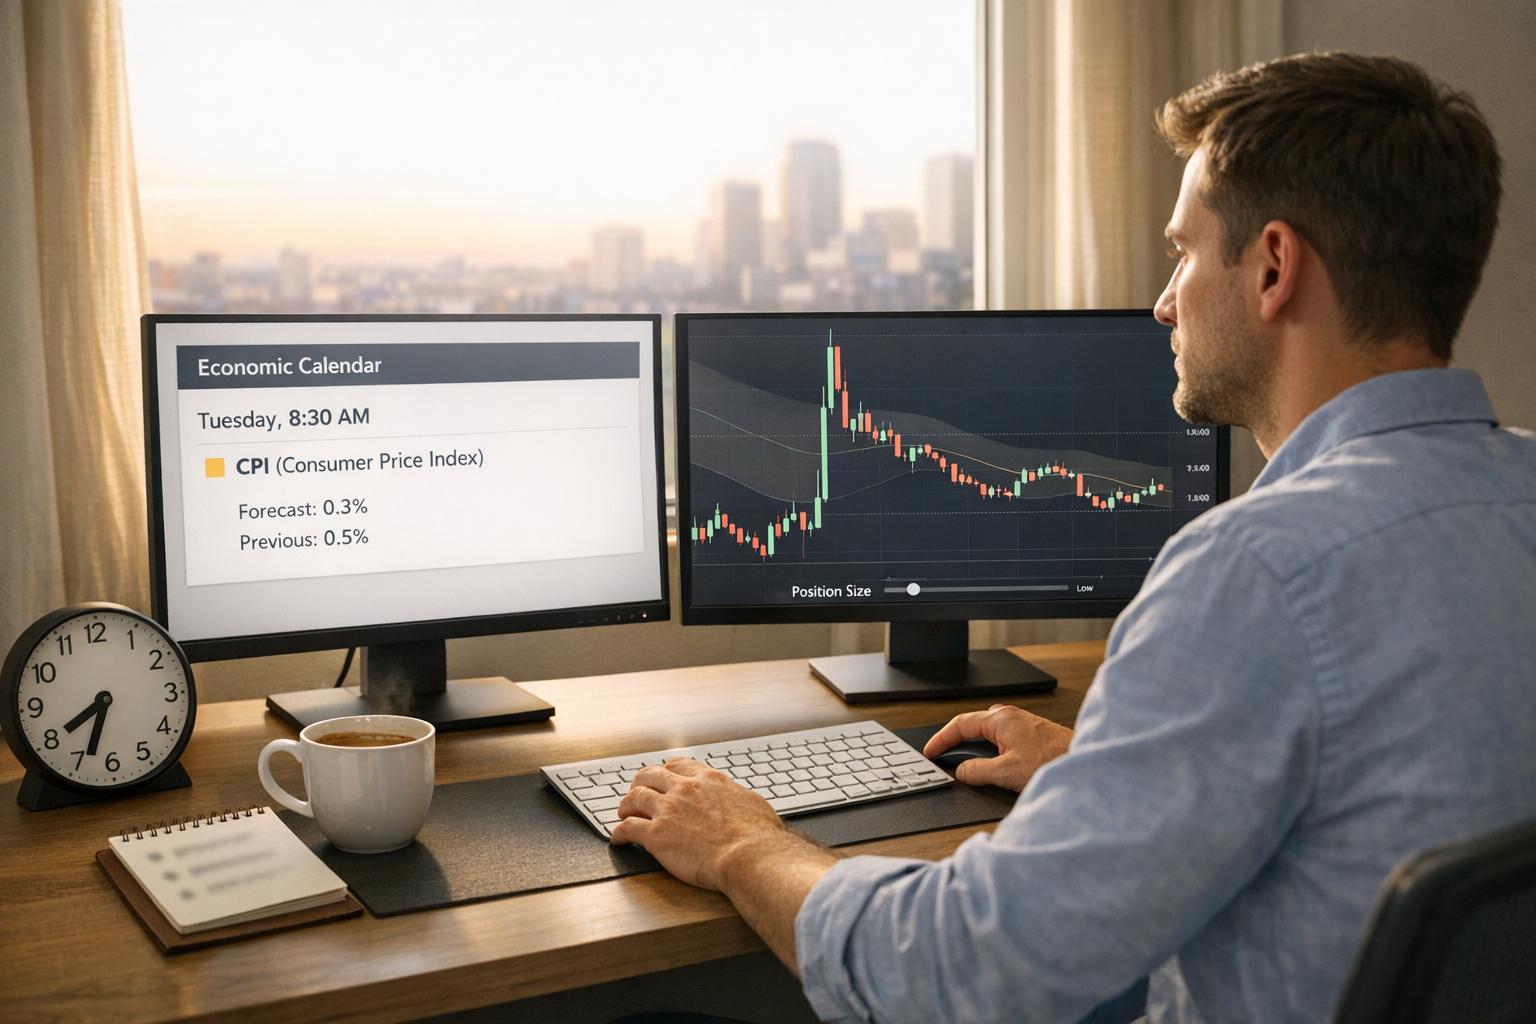
Before the 8:30 AM CPI release, traders can position themselves based on market expectations. Start by reviewing the consensus forecast, which reflects the average prediction of economists and analysts. This number is often already factored into the market. Compare it to the previous month's CPI to assess whether inflation is expected to rise or fall. Additionally, keep an eye on the "whisper number", an informal gauge of market sentiment that can hint at where big players are leaning.
Focus on assets that are especially sensitive to inflation reports. Major USD currency pairs like EUR/USD and USD/JPY are common choices, with USD/JPY being particularly reactive due to differing monetary policies between the Federal Reserve and the Bank of Japan. Commodity-linked pairs like AUD/USD and USD/CAD also tend to move sharply if CPI data deviates from expectations.
Instead of trying to predict the exact outcome, prepare for three scenarios: a higher-than-expected reading (beat), a lower-than-expected reading (miss), or a result matching the forecast. Use technical indicators like the 50- or 200-period moving averages to set stop losses and price targets.
"The absolute number doesn't matter as much as the deviation from the forecast. The market moves on surprises."
- Isabella Torres, Derivatives Analyst, FXNX
Be alert to "priced in" behavior. If the market has already shifted strongly in one direction before the release, even data that aligns with expectations might trigger a reversal or a "sell the fact" reaction.
| Scenario | Market Sentiment | Potential Trading Bias |
|---|---|---|
| Actual > Forecast (Beat) | Hawkish outlook (higher rates) | Bullish for currency / Bearish for risk assets |
| Actual < Forecast (Miss) | Dovish outlook (lower rates) | Bearish for currency / Bullish for risk assets |
| Actual = Forecast (In-line) | Muted or "sell the fact" | Neutral or reversal of pre-release trend |
Once the data drops, the focus shifts to breakout trading opportunities.
Breakout Strategy During CPI Release
When the CPI data is released at 8:30 AM, expect a surge in volatility. The first 1–5 minutes often produce "fakeouts", where sharp moves trigger stop losses on over-leveraged positions.
To navigate this, follow the 15-minute rule: wait for the first 15-minute candle to close before acting. This allows time for the initial chaos to settle and the real trend to emerge. Before the release, identify key support and resistance levels from the past 48 hours, as these often come into play during breakouts.
A common approach is the break and retest setup. Wait for the price to break a significant 15-minute support or resistance level and then enter after it retests that level. Confirm the breakout with a surge in trading volume, and avoid entering on weak volume.
"The 'Whipsaw' is a liquidity grab. Institutional players use this extreme volatility to fill their large orders at optimal prices."
- Navixa
To reduce risk, use limit orders to minimize slippage during this volatile period. Place your stop losses at the wick of the initial 15-minute "fakeout" candle. Additionally, monitor the US Dollar Index (DXY) for confirmation - a higher-than-expected CPI often pushes the DXY upward while pressuring risk assets like stocks.
After the breakout phase, the market often stabilizes, opening the door for potential reversal trades.
Post-Release Strategy: Fading the Initial Reaction
Fading the initial reaction can be effective when the market's response appears overdone or when the CPI data only slightly deviates from expectations (e.g., by around 0.1%). This strategy works by identifying when the market has already "priced in" the news. For instance, if the USD spikes after a CPI beat but the 2-Year Treasury Yield starts to decline, it could signal a temporary move that’s ready to reverse.
For beginners, look for candlestick patterns like Pin Bars or Shooting Stars on the 15-minute chart. These formations often indicate that the initial momentum is fading.
"The real money isn't made in the first 60 seconds of 'price discovery' - it's made in the 'Second Wave' that forms 15 minutes later."
- Marcus Chen, Senior Forex Analyst, FXNX
Stay mindful of Core vs. Headline divergence. If the Headline CPI sparks a market spike but the Core CPI (closely watched by central banks) points in a different direction, the early reaction may reverse. Use stop losses set at a distance equal to 1x ATR from the price spike to avoid being caught in secondary volatility. Also, be aware that spreads on major pairs can widen dramatically during high-impact releases, sometimes jumping from 1 pip to as much as 10–15 pips.
| Stage of Release | Timing | Market Behavior | Strategy Action |
|---|---|---|---|
| Stage 1: Initial Spike | 0–60 seconds | Liquidity gaps, slippage, and algorithmic moves | Avoid: High-risk early trading phase |
| Stage 2: Retracement | 1–10 minutes | Market seeks "fair value" as extreme positions unwind | Observe: Wait for liquidity to stabilize |
| Stage 3: Trend/Fade | 15+ minutes | Institutional volume enters, stabilizing the trend | Execute: Look for trend continuation or fade setups |
Risk Management in CPI Trading
CPI releases bring intense market volatility, demanding a tailored approach to risk management. Standard risk parameters often fall short in these fast-moving conditions.
Position Sizing and Stop Losses
During CPI events, widen your stop-loss range. For instance, if your usual stop is 20 pips, consider expanding it to 40–50 pips. However, to maintain consistent dollar risk, adjust your position size accordingly. If you normally trade 1.0 lot with a 20-pip stop, reduce to 0.5 or even 0.25 lots when using a 40-pip stop.
Place stop-losses strategically, such as behind key support or resistance levels, or at the wick of the initial 15-minute candle. Keep in mind that during CPI events, spreads can balloon from a typical 1 pip to as much as 8–12 pips. This spread widening can trigger stop-losses even if the price chart doesn't show your level being reached.
"Normal trading is driving on a road. CPI is the road disappearing while you're driving."
- Fulbari Picks
Be prepared for slippage. During high-impact news, liquidity often vanishes, causing prices to jump unpredictably. This can lead to stop-loss orders being filled at worse-than-expected levels. To mitigate this, consider using limit orders instead of market orders. While limit orders can help avoid unfavorable fills, they may not trigger if the price moves too quickly.
Avoiding Overleverage
High leverage during CPI events is a recipe for disaster. Price spikes of 50 pips in mere seconds can liquidate overleveraged positions before you even have a chance to react. Many beginners make the mistake of using their usual leverage, unaware of the amplified risks. This often leads to severe drawdowns or even account blowouts.
One safer approach, especially for newer traders, is the "stand-aside strategy". Close all open trades 30–60 minutes before the CPI release and wait for the market to settle. If you decide to trade, wait at least 15–60 minutes after the release for spreads to return to normal and for the market structure to stabilize. This patience can help you avoid the chaotic whipsaws caused by algorithms and knee-jerk reactions.
"You don't get paid for trading CPI - you get paid for surviving it."
- Fulbari Picks
If you choose to trade, calculate your position size carefully to match your risk tolerance and the widened stops. Some traders adopt a "7% rule", exiting any position that drops 7%–8% from the entry price to prevent catastrophic losses. Regardless of the method, the central principle is to trade smaller during CPI events than under normal market conditions.
These risk strategies are essential for navigating the unpredictable nature of CPI trading safely and effectively.
Practicing CPI Trading on For Traders

Mastering CPI trading requires precision and a disciplined approach. To effectively implement the strategies discussed earlier, consistent practice is essential. Jumping into live markets during CPI releases without preparation can result in costly errors.
Using Simulated Accounts for Practice
For Traders offers simulated accounts with virtual funds ranging from $6,000 to $100,000. These accounts let you test CPI trading strategies in a risk-free environment. Practicing here allows you to fine-tune your entry timing by observing how markets react after the initial volatility spike. This helps you differentiate between true breakouts and misleading signals.
Simulated accounts also provide a safe space to identify liquidity sweeps and false breakouts, which often occur right after the 8:30 AM ET CPI release. Tracking and reviewing these patterns can sharpen your ability to spot genuine market movements versus traps set for early participants.
You can also experiment with flexible stop-loss strategies. For instance, instead of sticking to a fixed 20-pip stop-loss, you could widen your stop during periods of high volatility while scaling down your position size to keep your dollar risk steady. Developing these skills in a simulated setting builds confidence and prepares you for the deeper insights available in For Traders' educational materials.
Using For Traders' Educational Resources
Hands-on practice becomes even more effective when combined with structured learning. For Traders provides an extensive library of video courses covering technical patterns, macroeconomic concepts, and how inflation data ties into central bank policies. For example, these courses explain why Core CPI - which excludes food and energy - often carries more weight with the Federal Reserve than Headline CPI. They also delve into housing's outsized role, given that it makes up 42.4% of the CPI basket.
In addition to video lessons, For Traders offers e-books and an active Discord community. Joining this community lets you discuss CPI trading setups, analyze market reactions to past releases, and refine your pre-release checklist. This checklist might include marking key support and resistance levels, keeping an eye on consensus forecasts, and noting "whisper numbers" that professional traders monitor. Combining structured education with peer interaction accelerates your ability to interpret inflation surprises and turn them into actionable trades.
Conclusion
Review of CPI Trading Strategies
When it comes to trading around CPI releases, success hinges on how well you can anticipate market surprises rather than just focusing on the headline figures. As Bitget Academy explains:
The most effective CPI trading strategy is based on forecast vs actual deviation, not the headline number. Markets react to surprises rather than expectations, making deviation the core trading edge.
Your advantage lies in identifying the gap between forecasted and actual data. The guide outlines a three-phase framework - preparation, observation, and execution - to help you navigate the volatility that typically spikes around 8:30 AM ET. Timing is crucial. In the first 1–5 minutes, algorithmic trading often dominates, so waiting for the 5–15 minute window can provide a clearer sense of the market's true direction.
Pairing this tactical approach with risk management strategies is essential for handling the unpredictability of CPI-driven market moves. With these tools, you’re better equipped to refine and execute your trading strategies effectively.
Next Steps for Beginners
Now it’s time to put theory into action. Start by using simulated accounts on For Traders to practice your timing and risk management skills without risking real money. Dive into the platform's video courses to gain a deeper understanding of how inflation data impacts Federal Reserve decisions and currency markets. Joining the Discord community is another great way to engage with other traders and discuss live CPI setups.
As you grow more confident, create if-then scenarios before each CPI release and maintain a trade journal to analyze which setups work best. For Traders' educational tools and community support can help you fine-tune your approach over time. With consistent practice and a commitment to learning, you can turn CPI-driven volatility into a source of trading opportunities.
FAQs
Which CPI number matters most - Headline or Core?
The Headline CPI holds significant importance because it captures overall inflation, including volatile categories like food and energy prices. These components directly influence market expectations and can drive volatility. On the other hand, Core CPI excludes food and energy, making it a tool primarily used to assess long-term inflation trends without the noise of short-term fluctuations.
How big of a CPI “surprise” is worth trading?
A deviation in the Consumer Price Index (CPI) of around 0.2% or more can be a big deal for traders. When the actual CPI figures differ significantly from market expectations, it often stirs up volatility, creating opportunities to trade. These shifts can offer traders valuable insights and the chance to act on rapid market changes.
What’s the safest way to trade CPI as a beginner?
The best approach for beginners trading around CPI data is to avoid acting on sudden market movements. Let the initial volatility play out before making any trading decisions. Prioritize risk management by setting stop-loss orders to protect your positions and stick to a well-thought-out plan. Base your strategy on a careful comparison of forecasted and actual CPI figures. Staying patient and prepared will help you handle the ups and downs of CPI-driven market activity.
Related Blog Posts
Start Trading with For Traders
Join our platform to test your trading skills, trade virtual capital, and earn real profits. Access educational resources, advanced tools, and a supportive community to enhance your trading journey.
Start your Trading Challenge