
Most prop traders fail for one reason: they break risk rules before they reach the profit target.
If I want to pass an evaluation, I need to treat my trading data like a control panel, not a report card. On a $50,000 account, a $1,500 daily loss limit or a $2,500 max drawdown can disappear fast if I keep trading after a bad setup, size too big, or ignore my buffer.
Here’s the short version:
- I track daily P&L, drawdown room, trade count, and rule breaks
- I review losing days to see if losses came from the market or from me
- I cut size based on my last 20–30 trades, not on hope
- I use a fixed daily and weekly review routine to stay inside the rules
The big idea is simple: passing is less about picking winners and more about avoiding account-ending mistakes. A journal, live dashboard, and clear sizing rules help me do that.
This article shows how I use data to review bad days, spot rule violations, size positions with more care, and stick to a repeatable process until the evaluation is done.
Know the Data That Determines Pass or Fail
Key Evaluation Rules and Their Dollar Impact
Every prop evaluation comes down to a few hard limits. If you break one, you're out. The three that matter most are the profit target, the maximum drawdown, and the daily loss limit.
On a $100,000 account with a 9% profit target and 5% max drawdown, the math is simple: you need to make $9,000 to pass, and you can't lose more than $5,000 in total before the account is disqualified. The daily loss limit, often set at 2% to 3%, puts a cap on how much damage one bad day can do. At 3%, that means $3,000 on a $100,000 account.
| Rule | % (Example) | $ on $50K Account | $ on $100K Account |
|---|---|---|---|
| Profit Target | 9% | $4,500 | $9,000 |
| Max Drawdown | 5% | $2,500 | $5,000 |
| Daily Loss Limit | 3% | $1,500 | $3,000 |
There’s one more catch. If your evaluation includes a consistency rule, one huge winning day can still sink the account even if you hit the target.
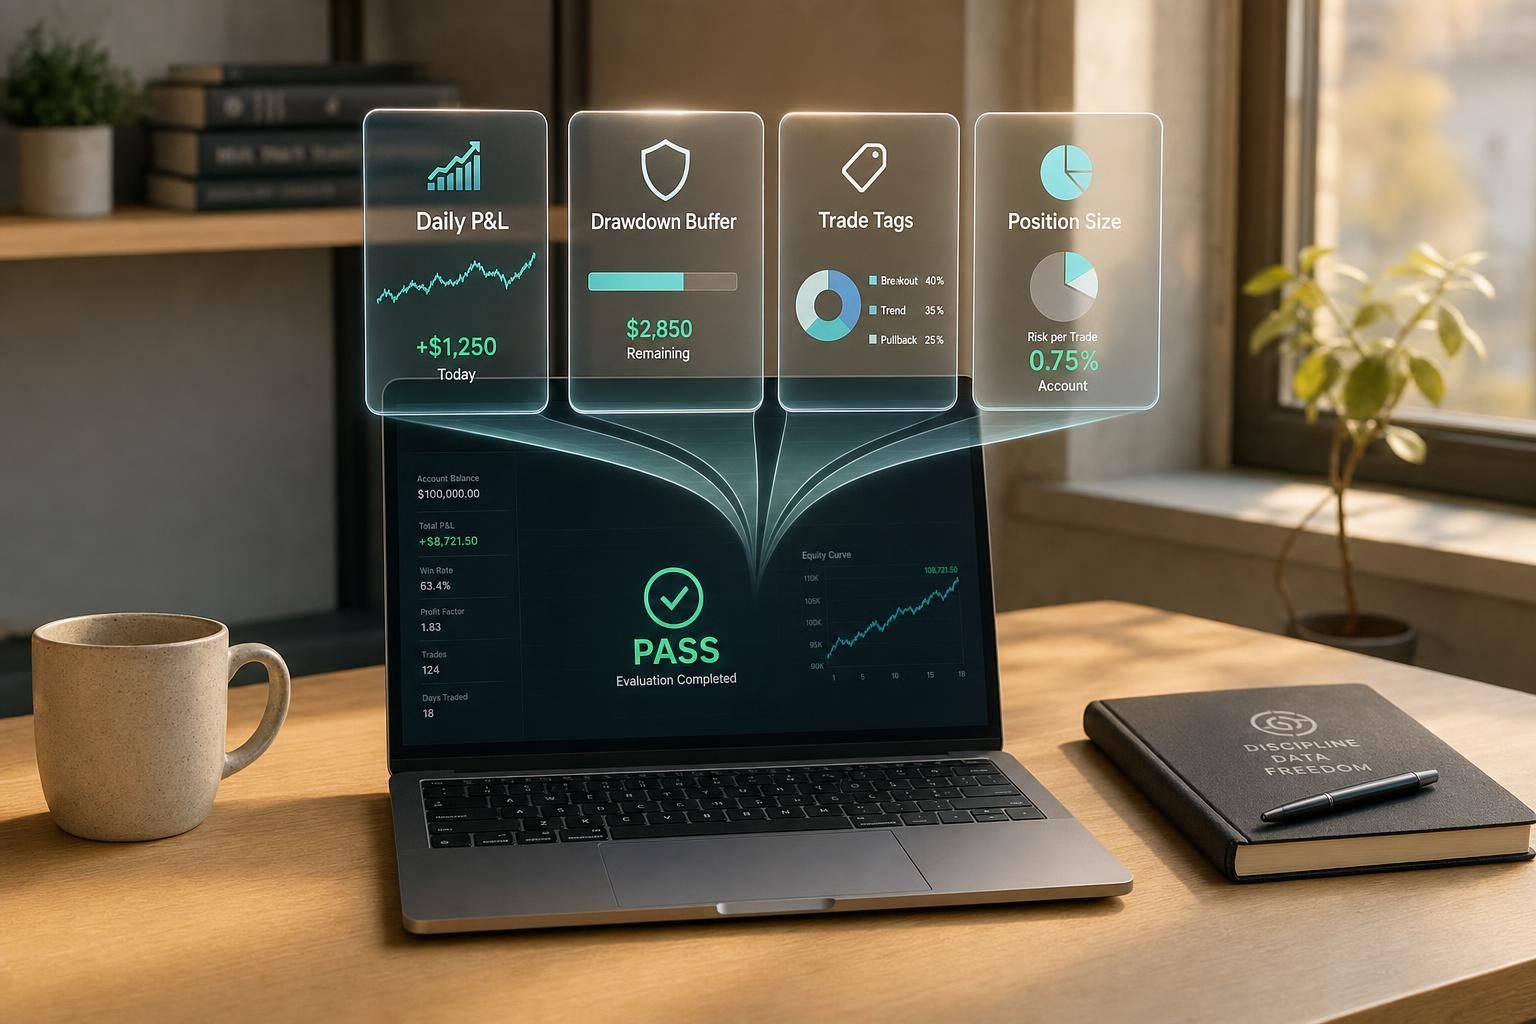
Account Dashboard, Daily Stats, and Trade Logs
Those rules show up in three places: your dashboard, your stats, and your trade log.
Your dashboard gives you the numbers that matter in real time: current balance, floating equity, unrealized P&L, and, most of all, the distance between current equity and the fail line. That last number tells you how much space you have left, not just how much you've made.
Daily stats help you see if your edge is holding up. The trade log shows whether you stuck to the plan.
Your trade log is where behavior shows up on paper. A solid entry should include:
- Date (MM/DD/YYYY)
- Symbol
- Side
- Size
- Entry price
- Stop-loss
- Take-profit
- Result in both USD and R-multiple
- A note on rule adherence
That last field - Rule break: yes/no - turns a plain spreadsheet into something you can use. It helps you separate losses caused by bad process from losses that came from a valid setup.
"The journal is the difference between catching a rule violation before it happens and explaining the failure to yourself afterward." - Adam Hardegree, Founder, Trade Journal AI
Using For Traders Metrics During the Evaluation
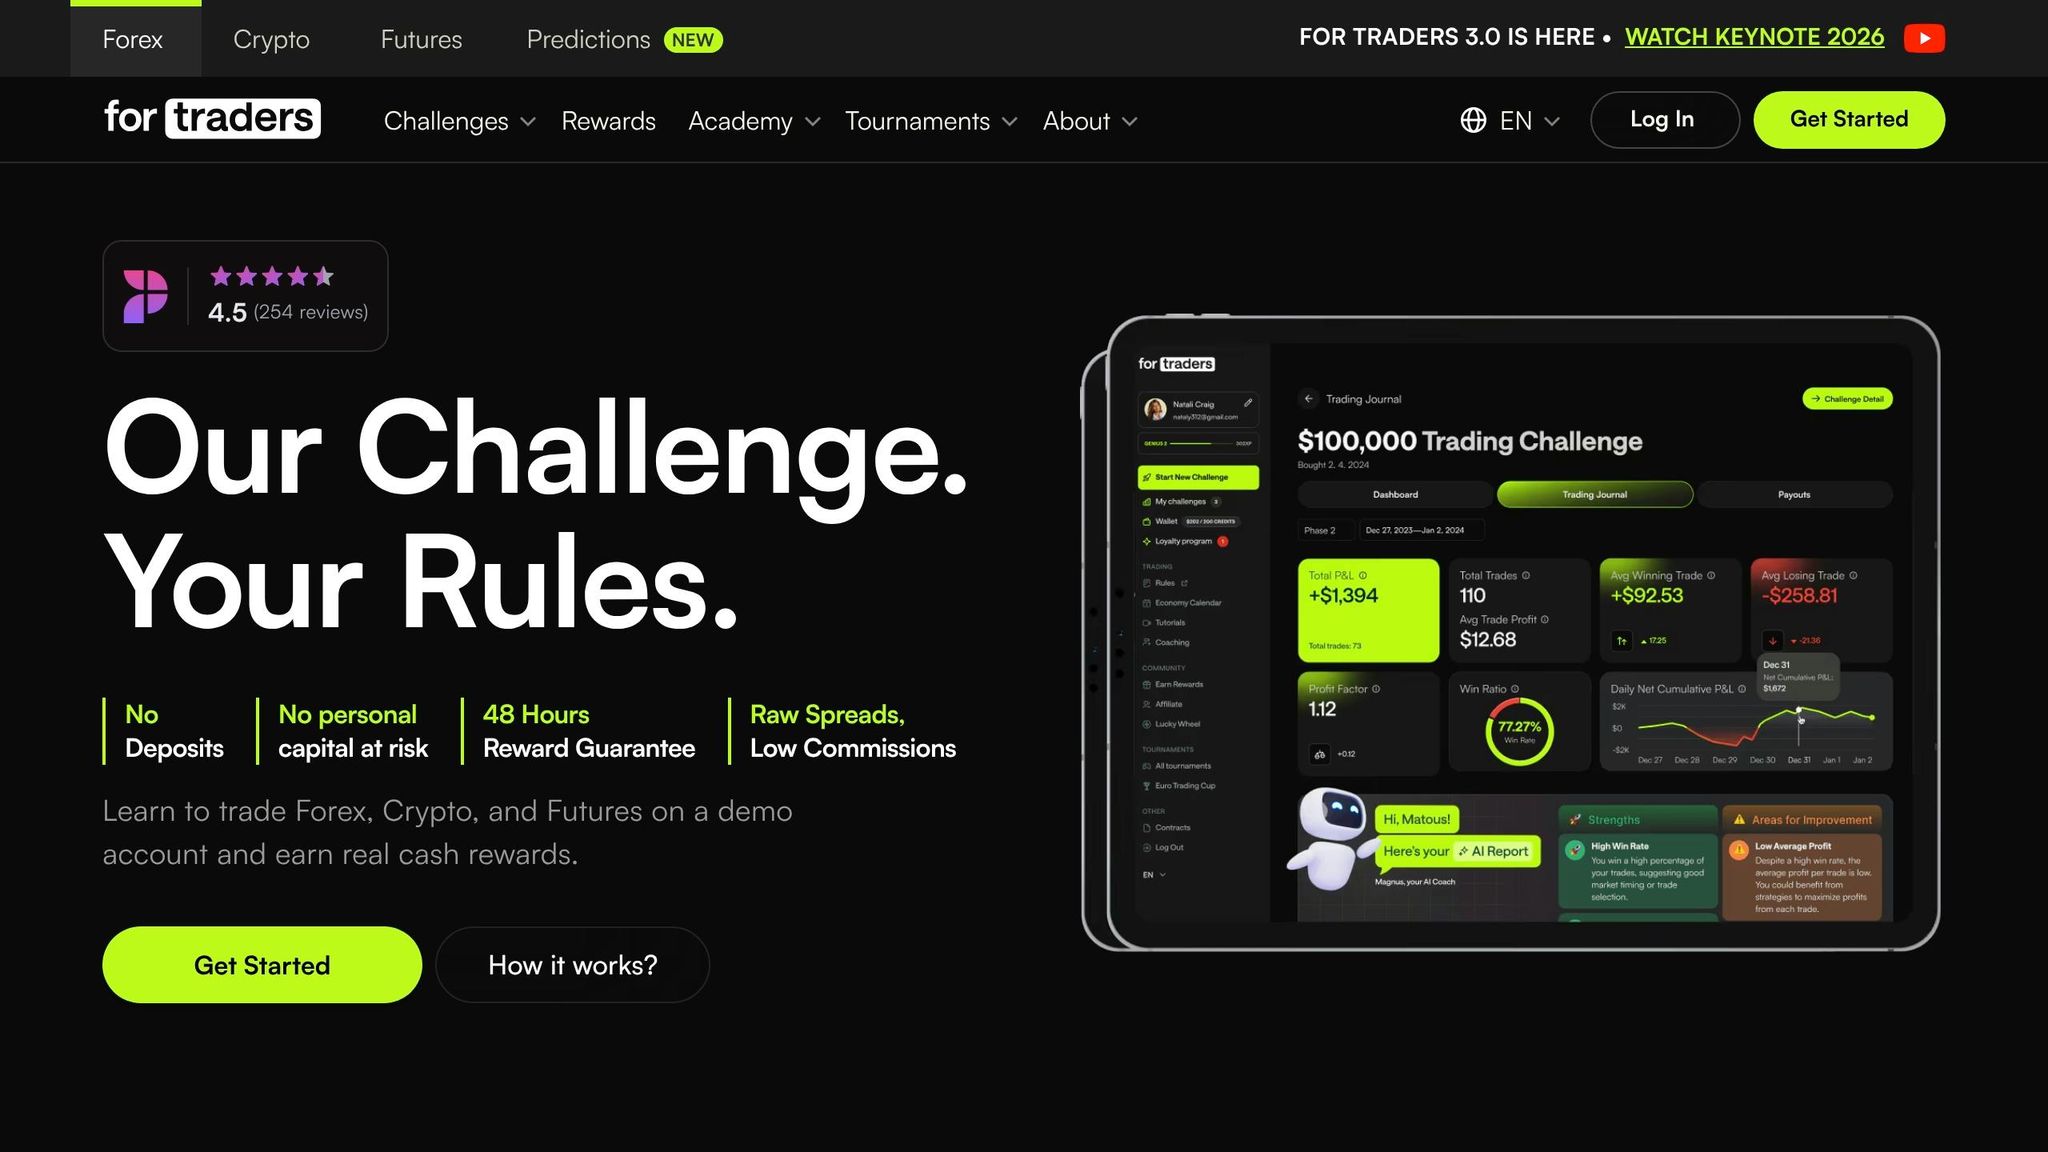
For Traders provides virtual capital accounts with defined targets and drawdown rules. On its $100,000 virtual capital account, for example, the 9% profit target and 5% max drawdown are built right into the platform, so you can see the key thresholds without doing the math yourself.
Use the platform for live rule checks. Use your journal to explain why the numbers changed.
Once those numbers are in front of you, the next move is to review which losing days came from rule breaks.
How to Review Losing Days and Catch Rule Breaks
Build a Daily Review Checklist
After the U.S. session closes, review the day in a set way. That makes it easier to see where the damage came from instead of guessing.
Focus on five numbers:
- daily P&L
- loss-limit usage
- trailing drawdown buffer (often found in firms with low drawdown rules)
- trade count
- rule breaks
That gives you a clean snapshot of the day. You can spot whether the issue was one bad trade, too many trades, or a day where rules started slipping.
Add a short mindset note for each day too - "Calm", "Revenge", or "FOMO" - so you can tie your behavior to the trades that did the most damage.
Tag Trades to Separate Plan-Following Mistakes from Rule-Breaking Losses
Not every losing trade means something went wrong. Sometimes the setup was fine and the market just didn't cooperate. The key is knowing why most traders fail and identifying why your specific loss happened.
After a bad session, pull up your trade log and sort it by time. Then tag each trade:
- Plan Deviation: you broke a written rule
- Execution Error: the plan was fine, but the entry or exit was poor
- Market-Condition Mismatch: the setup didn't fit current conditions
Then total the dollar loss for each tag. That shows you where the fix needs to happen. Maybe execution is sloppy. Maybe your filter is weak. Maybe your rules need to be tighter.
A personal daily loss cap set at 60% to 70% of the firm's official limit gives you a buffer before you hit the hard stop.
Use a Tracking Table to Make Patterns Clear
One bad day can fool you. A few days side by side tell a much better story. That's where a weekly tracking table helps.
| Date | # of Trades | Daily P&L | Rule-Breaking Trades | % of Loss from Rule Breaks |
|---|---|---|---|---|
| 06/16/2026 | 8 | -$1,400 | 2 | 71% |
| 06/17/2026 | 5 | -$600 | 0 | 0% |
| 06/18/2026 | 11 | -$2,100 | 4 | 83% |
| 06/19/2026 | 6 | +$900 | 0 | - |
| 06/20/2026 | 9 | -$1,750 | 3 | 68% |
Patterns start to jump out fast. If rule-breaking trades keep doing most of the damage, the issue isn't the market. It's behavior.
If the same rule breaks keep showing up after two consecutive losses, stop trading those conditions for the day. Then use that repeat pattern to set tomorrow's risk limit and position size.
Ex-Prop Firm Owner Tells You How to Pass an Evaluation (Data-based)
How to Adjust Position Size Using Past Performance
Prop Evaluation Risk Rules: Position Sizing by Drawdown Cushion
Turn Evaluation Rules into a Risk Budget
Once you know where your losses come from, turn that into a hard sizing rule. Start each trade by converting the firm's max drawdown and your current equity into a dollar risk budget. Then size from the drawdown room you still have left, not from your full account balance.
On a $50,000 account with a 5% max drawdown, your loss ceiling is $2,500. Simple enough. But here's where traders get into trouble: they keep trading as if the full cushion is still there, even when it's not. If your losing-day review shows that rule breaks get worse when your buffer gets tight, cut risk before you hit the hard stop.
Once that dollar budget is set, use your own trade log to decide how much to risk on each trade.
Use Win Rate, Losing Streaks, and Drawdown to Set Risk Per Trade
Look at your last 20 to 30 trades. Focus on three numbers from your journal:
- win rate
- average loss
- worst losing streak
Use those numbers to choose a fixed risk level, such as 0.25%, 0.5%, or 1% per trade.
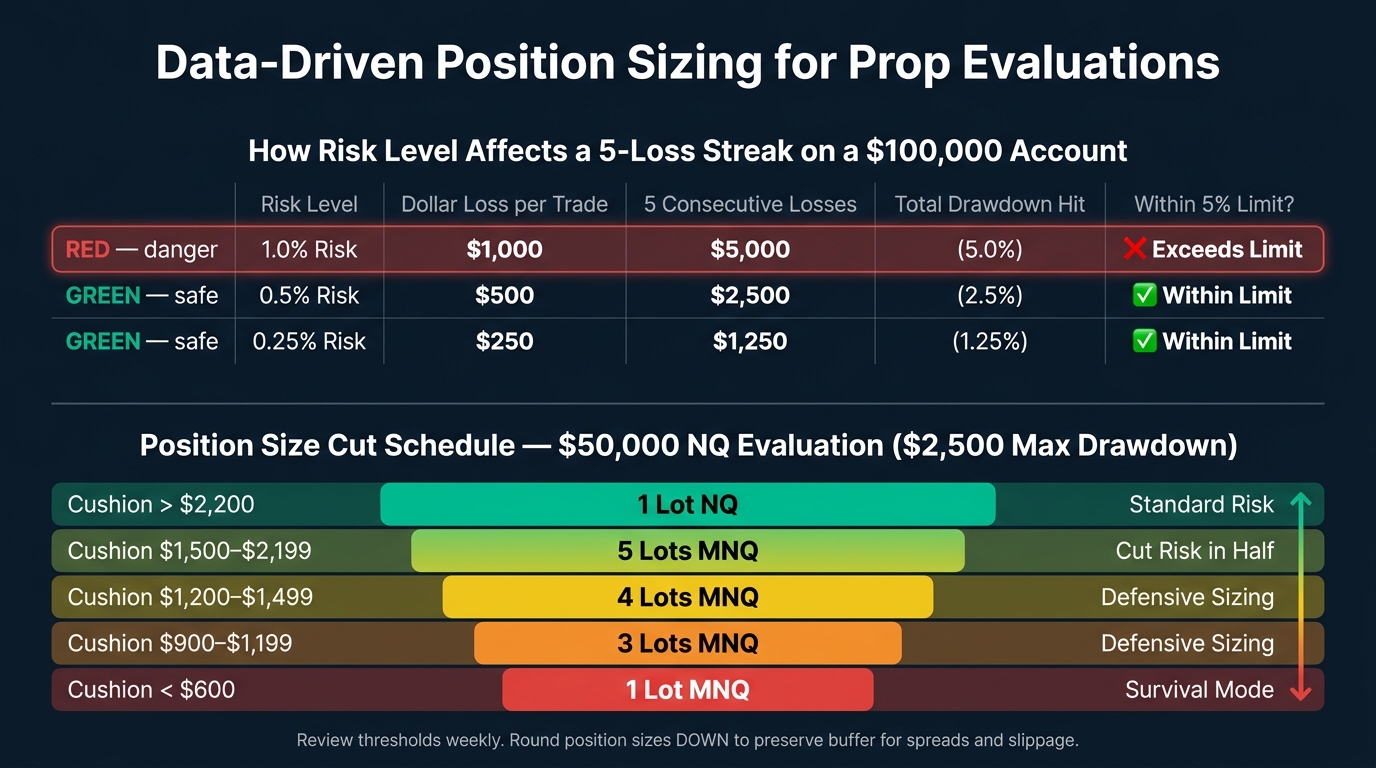
A 60% win rate sounds solid, but it can still come with 4 to 5 straight losses. And that matters. At 1% risk per trade, a bad streak can hit a 5% daily limit fast.
| Risk Level | 5 Consecutive Losses | Within 5% Limit? |
|---|---|---|
| 1.0% Risk | $5,000 (5.0%) | No |
| 0.5% Risk | $2,500 (2.5%) | Yes |
| 0.25% Risk | $1,250 (1.25%) | Yes |
Based on a $100,000 account.
Set Data-Driven Sizing Rules and Review Them Weekly
Set your step-down schedule before the session starts, and treat it like a rule, not a suggestion. If your buffer drops below a set threshold, cut risk in half. Let the drawdown room on your account dashboard decide when size changes happen, not your in-session mood.
Here’s one sample cut-size schedule for a $50,000 NQ evaluation with a $2,500 drawdown:
| Drawdown Cushion | Position Size | Action |
|---|---|---|
| > $2,200 | 1 Lot NQ | Standard Risk |
| $1,500 – $2,199 | 5 Lots MNQ | Cut Risk in Half |
| $1,200 – $1,499 | 4 Lots MNQ | Defensive Sizing |
| $900 – $1,199 | 3 Lots MNQ | Defensive Sizing |
| < $600 | 1 Lot MNQ | Survival Mode |
Source: trekke's NQ Trading Journal.
Review those thresholds once a week and change them only after that review. Also, round position sizes down to the nearest micro or mini lot so you keep a small buffer for spreads and slippage. Then use the schedule in the next session and check the results in your daily review.
Build a Review Routine and Stay Consistent
Daily Pre-Market, In-Session, and End-of-Day Workflow
Once your risk limits are set, lock them into a fixed daily routine. Before the open, check your risk numbers. Look at your current equity against your profit target, your remaining drawdown buffer, and any macro events on the calendar - like FOMC, CPI, or NFP - that could trigger a prohibited news window.
During the session, treat your live P&L as a risk signal. Green means you're in normal range. Yellow means you're getting close to your daily limit, so pull back. Red means stop.
After the close, update your trade log and tag each trade right away. Daily check-ins help you stay inside the rules. Weekly reviews show you what needs to change.
Weekly Review and Performance Adjustments
Once a week, go through your last 20–30 trades and update your win rate, expectancy, and drawdown. Then look at your rule violations and ask when they showed up. A lot of the time, they bunch up on certain days or after a hot streak, when confidence slides into overtrading.
Use that data to make one or two clear changes for the next week. If your drawdown buffer is getting tight, cut size before taking more trades. Set your personal daily stop with enough room for slippage and emotional mistakes. If you're using For Traders, the platform's Discord community can help keep you accountable while you reset your rules. Then bring those changes into the next week.
Conclusion: How Data Turns Evaluation Rules into a Working Process
Passing a prop evaluation isn't about finding the perfect entry. More screen time usually isn't the answer either. The answer is a tighter process.
Track the metrics that matter. Review losing days up close. Put a dollar amount on every rule break. Size positions based on your own performance data. Then run the same daily and weekly routine every week. Steady, data-based decisions - not bigger size - are what move traders from repeat attempts to a funded account.
FAQs
What should I track each day during an evaluation?
Track a daily dashboard with your starting balance, current equity, and cumulative profit and loss.
You should also watch your remaining daily loss buffer, trailing drawdown buffer, consistency ratio, and your progress toward the profit target and minimum trading days.
A quick daily review of these numbers helps you adjust position size, avoid nasty surprises, and stay within the evaluation rules.
How do I tell a bad trade from a rule break?
A bad trade happens when the setup or market read doesn’t work out, even though you stuck to your plan. A rule break is different. That’s when you step outside your own guardrails, like using too much leverage, trading during blocked news events, or revenge trading after a loss.
To separate the two, tag each trade in your journal by what went wrong:
- Execution errors
- Plan deviations
- Information errors
How should I cut size after a losing streak?
After a losing streak, treat your account like a different account. It’s smaller now, which means your room for risk is smaller too. The size you used before may not fit anymore. So the move is simple: either sit out for a bit or cut your size.
You also want a hard stop rule based on your own data. For example, stop trading after two or three losses in a row. That rule helps you avoid digging a deeper hole when you’re off your game.
If you do keep trading, scale down. Use smaller instruments, and size each position from what’s left between your current balance and your drawdown limit, not from your starting balance.
Related Blog Posts
Start Trading with For Traders
Join our platform to test your trading skills, trade virtual capital, and earn real profits. Access educational resources, advanced tools, and a supportive community to enhance your trading journey.
Start your Trading Challenge