
The secret to consistent trading success lies in using a structured feedback loop. Instead of reacting emotionally or abandoning strategies too soon, traders can refine their approach by analyzing results, identifying patterns, and making data-driven adjustments. Here’s a quick breakdown of how feedback loops can transform your trading:
- Feedback Loops: Evaluate every trade to separate luck from skill and focus on long-term improvement.
- Key Metrics to Track: Win rate, profit factor, maximum drawdown, and Sharpe Ratio provide critical insights.
- Process Goals Over Outcome Goals: Focus on actions you can control, like following a checklist or journaling trades effectively.
- Data-Driven Adjustments: Use trade logs to spot weaknesses, test small changes, and refine your strategy step by step.
- Tools and Resources: Platforms like For Traders and journaling software simplify tracking and testing.
Learn The Feedback Loop Every Consistent Trader Builds
Core Components of a Trading Feedback Loop

Essential Trading Performance Metrics and Benchmarks for Strategy Evaluation
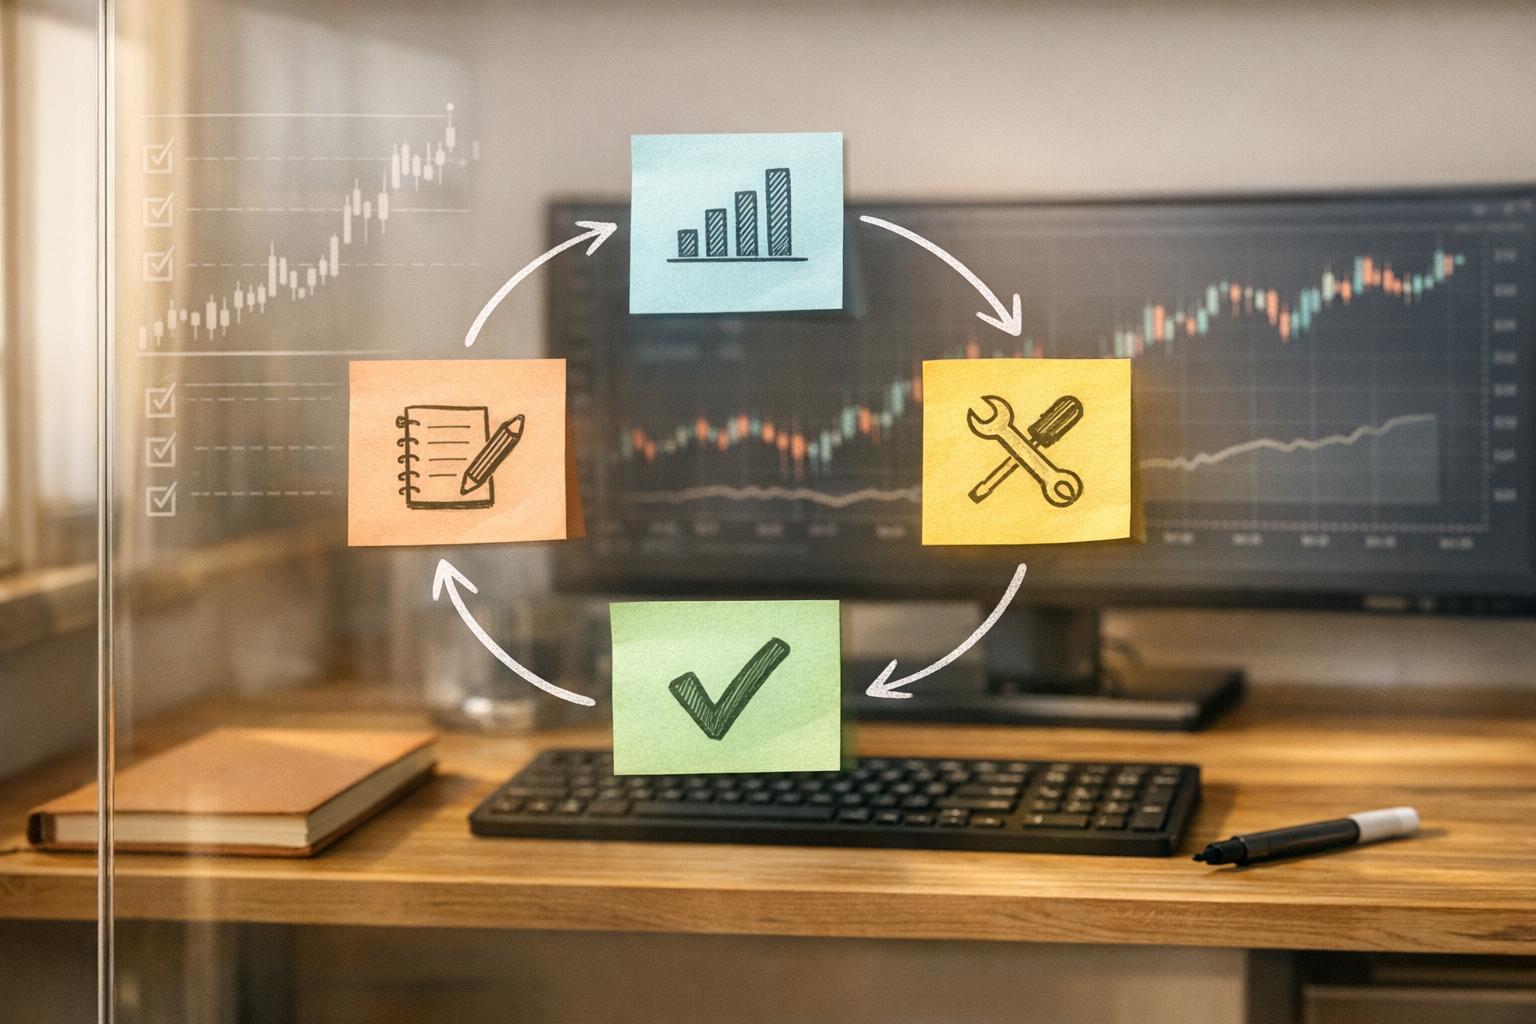
A solid feedback loop in trading revolves around four steps: Plan, Execute, Analyze, and Refine. To make this process work, you need to track meaningful metrics, set realistic goals, and interpret your data effectively.
Tracking Performance Metrics
The key to improving your trading is tracking metrics that expose your edge. This includes details like entry/exit prices, the technical reasoning behind trades, the market context, and even your emotional state. Without these, it’s hard to pinpoint what’s actually working.
Some metrics are more insightful than others. For example:
- Win rate shows how often you’re right, but it doesn’t tell the whole story. Many profitable systems operate with win rates as low as 30–40% when paired with a strong risk-to-reward ratio.
- Profit factor, calculated by dividing gross profit by gross loss, provides a clearer view of performance. Most professional traders aim for a profit factor between 1.75 and 2.0 or higher. Anything below 1.0 signals a losing system that needs to be scrapped.
- Maximum drawdown helps you gauge your largest peak-to-trough loss. Ideally, this should stay under 10%, as larger drawdowns (over 20%) can lead to emotional mistakes and poor decision-making.
- The Sharpe Ratio, which measures risk-adjusted returns, is another critical metric. Quantitative funds often disregard strategies with ratios below 2.0.
To keep things manageable, apply the 80/20 rule: focus only on the metrics that have the biggest impact. Organize your tracking with a three-layer review system:
- Daily Reviews: Examine your discipline, emotional state, and any rule-breaking.
- Weekly Reviews: Look for patterns in setups, time of day, or instrument performance.
- Monthly Reviews: Assess the overall strength of your strategy, its expectancy, and how it aligns with long-term goals.
For accurate strategy evaluation, you need a sufficient sample size. According to Cochran's formula, at least 101 trades are required for 70% confidence in expectancy calculations, and 666 trades for 99% confidence. Avoid judging a strategy based on a small number of trades - analyze results in batches of 20–50 to uncover meaningful trends.
Once you’ve identified the right metrics, the next step is setting goals that guide your improvements.
Setting Achievable Goals
Goals in trading should focus on the process, not outcomes. Why? Because process goals are within your control, while outcome goals depend on unpredictable market conditions. For example:
| Outcome Goals (Unreliable) | Process Goals (Reliable) |
|---|---|
| "Make $5,000 this month" | "Follow my trading checklist for every trade" |
| "Achieve a 65% win rate" | "Journal all trades within 1 hour of closing" |
| "Double my account balance" | "Risk exactly 1% per trade, no exceptions" |
Research shows that 92% of trading goals fail when they focus on outcomes. Unrealistic goals often lead to poor decisions like overtrading, excessive risk-taking, and abandoning sound risk management principles. In fact, 90% of day traders who pursue unrealistic returns lose money in their first year.
To create effective goals, use the SMART framework: make them Specific, Measurable, Attainable, Relevant, and Time-bound. Break annual objectives into 90-day sprints so you can adjust based on recent data without overreacting to short-term results. Also, prioritize tracking your adherence to trading rules over profit and loss. Aim for an 80%+ adherence rate - if you’re disciplined but still not profitable, it’s likely your strategy, not your behavior, that needs adjustment.
With clear goals in place, your data becomes the tool for refining your approach.
Using Data to Adjust Strategies
Once you’ve established metrics and set achievable goals, the real work begins: using your data to fine-tune your strategies. The goal is to identify weaknesses and implement targeted adjustments. If multiple issues arise, focus on fixing one or two at a time. Tackling everything at once can make it hard to determine what’s actually working.
For example, a drop in your win rate - say, a 10% decline over two weeks - might signal that your strategy needs a closer look. Similarly, if you notice consistent losses during specific times (like Friday afternoons or mornings), try pausing trades during those periods for a month to see if your performance improves.
"It's essential to wait for trades with good risk/reward ratios. Patience is a virtue for traders."
– Alexander Elder, Global Trading Authority
Segment your data by strategy type (e.g., trend trades versus range trades) to see which ones are driving profits. Use this insight to make specific rule changes, such as tightening stop-losses, avoiding certain trading days, or focusing on high-probability setups. If you notice patterns like revenge trading, consider implementing a mandatory 30-minute break after each loss.
Platforms like For Traders allow you to test these changes in a simulated environment before applying them to live trades. This way, you can minimize costly mistakes while refining your approach.
Collecting and Analyzing Trading Feedback
Closing the trading feedback loop is crucial for growth. What separates traders who improve from those stuck in repetitive mistakes is a structured approach to feedback. Without it, you're left guessing. Research indicates that traders who consistently maintain a journal improve their performance two to three times faster than those who don’t.
Recording Your Trades
Start by logging the core details of each trade: numbers like entry/exit points, position size, and profit or loss; the context, such as market conditions, setup type, and time; and your emotional state during the trade. Since memory can be unreliable, take screenshots of charts at both the entry and exit points to verify your decisions.
A three-tier review process works best: spend 5 minutes daily, 30 minutes weekly, and 1–2 hours monthly reviewing your trades. This layered approach keeps you thorough without feeling overwhelmed.
For recording trades, you have options. Manual spreadsheets (e.g., Excel or Google Sheets) allow full customization but demand consistent effort. Alternatively, platforms like TraderLens, Edgewonk, or FX Replay can automate the process by importing trades directly from your broker via API. These tools calculate advanced metrics like Profit Factor and Sharpe Ratio, saving up to 40% of journaling time and reducing errors. If you're practicing through For Traders' simulated challenges, their demo environment is a great place to prepare for your first trading challenge by building your journaling habits before transitioning to live trading.
"Successful traders spend as much time studying themselves and their trading as studying markets. In the patterns of your best and worst trades is the information that can make you the best trader you can be."
– Dr. Brett Steenbarger, Trading Psychologist
Consistency matters more than complexity. Tag each trade with specific labels, such as setup types ("Breakout", "Pullback"), mistakes ("Moved Stop", "Early Exit"), or emotional states ("FOMO", "Confident"). These tags allow you to filter reports and identify which behaviors are costing you money.
Once your trades are well-documented, you’ll start to see actionable patterns emerge.
Finding Patterns in Your Trading Data
The next step is identifying the patterns that define your trading edge. Break down your performance by factors like setup type, market session (e.g., London, New York, Asia), or trade direction (long vs. short). You might find that certain setups thrive in specific sessions while struggling in others.
Statistical reliability is key. Fewer than 10 trades won’t reveal much, 20–30 trades may start to show trends, and 50 or more trades are usually needed to confirm adjustments.
Classify your losses to pinpoint areas for improvement. Divide them into three categories:
- Strategy Losses: When you followed your rules, but the market didn’t cooperate.
- Execution Losses: When poor timing affected an otherwise valid setup.
- Emotional/Random Trades: Trades driven by boredom, frustration, or FOMO.
A simple yet effective method is the "Sticky Note" technique. After your weekly review, write down one key mistake to eliminate and one pattern to exploit. Stick this note on your monitor as a constant reminder throughout the week.
Another useful metric is Expected Value (EV), calculated as:
EV = (Win Rate × Average Win) – (Loss Rate × Average Loss)
A positive EV means your system has a mathematical edge, while a negative EV signals the need for adjustments.
Be alert for red flags in your data. For instance, if your average loss size is creeping up - perhaps due to moving stops or taking larger positions - consider capping your risk at 1% per trade for a set period. If you notice consistent losses during specific times, like Friday afternoons, pause trading during those periods and reassess the results over time.
Reinforcing vs. Balancing Feedback Loops
Reinforcing loops occur when rule-breaking leads to profitable trades, encouraging bad habits. To combat this, grade your execution separately from your profit and loss. Assign a letter grade (A–F) to each trade based on how well you followed your plan. This helps identify areas needing improvement.
Balancing loops, on the other hand, correct deviations. If your journal highlights recurring mistakes, like revenge trading after losses, create rules to address them. For example, if you consistently lose during specific times, take a break from trading during those hours to avoid emotional decision-making.
The ultimate goal is to reinforce good habits while systematically addressing bad ones. Many professional traders see the market as a mirror, reflecting their beliefs, emotions, and execution discipline. By consistently collecting and analyzing feedback, you turn random experiences into insights that build over time. These insights will guide the strategic adjustments discussed next.
How to Implement Strategy Adjustments
Once you've gathered feedback, the next step is turning those insights into actionable strategy tweaks. This isn't about flipping your entire approach overnight - it’s about making steady, calculated adjustments that yield better results over time. A measured approach, combining careful analysis and disciplined testing, is key.
Identifying Weak Points in Your Strategy
Start by digging into your key metrics to find areas that need improvement. For instance, a high win rate but a low profit factor could mean you're cutting winners too early. On the other hand, a high maximum drawdown might highlight issues with risk management or position sizing. Break your performance down across different market conditions. If your strategy only thrives in bull markets, it might be time to introduce a regime filter.
To avoid hindsight bias, try bar-by-bar simulation. Tools like "Blind Mode" can hide future bars and dates, forcing you to make decisions in real time without subconsciously favoring known winners.
Documenting your trade logic and emotions is another effective way to spot issues. Tag patterns like rule violations or emotional triggers that lead to losses. This helps you separate strategic flaws (like poor rules) from behavioral mistakes (like failing to follow those rules). If you're using For Traders' simulated challenges, their demo environment offers a safe space to test and identify these weaknesses before putting real money on the line.
Aim to simulate at least 100–200 trades to ensure your conclusions are solid.
Once you've pinpointed the weak spots, it’s time to experiment with targeted adjustments.
Testing and Refining Changes
When testing changes, avoid overhauling everything at once. Focus on one adjustment at a time to clearly see its impact.
Set aside 20–30% of your historical data as an out-of-sample set. This helps test adjustments in conditions your strategy hasn’t "seen" before. Without this step, over 90% of strategies that perform well in backtests fail in real trading.
Keep transaction costs in mind. Use the "Double Cost" Rule: if doubling your estimated commissions and slippage makes your strategy unprofitable, it’s too fragile for live markets. Ignoring these costs can inflate profitability by up to 30%. Model realistic fills, include slippage (at least 1 tick), and account for swap fees from the start.
Monte Carlo simulations are another valuable tool. They provide a range of possible outcomes, including worst-case drawdowns. Define your stop criteria early - write down specific conditions for shutting down a strategy, like exceeding a drawdown threshold based on your Monte Carlo results, before you go live.
"Backtesting is not a way to predict the future. It is a way to prevent obvious mistakes."
– Finaur
Before transitioning to live trading, conduct a 4–8 week "dress rehearsal" in a live market using a demo account. This step ensures your execution logic works and that real-market fills align with your backtest results. When you're ready to go live, start with smaller position sizes and gradually scale up to confirm your strategy holds up under real conditions.
Using Educational Resources to Improve
After fine-tuning your strategy, bolster your knowledge with additional learning tools. Resources like video courses and e-books can help you better understand not just how an adjustment works, but why it works.
For Traders offers a library of over 12 video courses covering topics such as risk management and advanced technical analysis. These materials can deepen your understanding and help refine your approach.
AI-driven tools can also be incredibly helpful. For example, AI chatbots in journaling platforms can analyze your trading data and answer specific questions like, "What mistakes do I most often make on Fridays?" This level of interaction allows you to uncover patterns and actionable insights faster.
Don’t underestimate the value of community support. Platforms like Discord allow you to share your process, get feedback, and learn from others. Engaging with other traders can reveal blind spots or alternative strategies you might not have considered. The For Traders community is a great space for bouncing ideas around and learning from peers.
Finally, keep a versioned log of every change you make. Document the parameters, the data used, and your reasoning for each adjustment. This practice not only helps you track performance changes but also keeps you disciplined as you evolve as a trader.
Common Mistakes and How to Maintain Progress
Avoiding Common Feedback Mistakes
One frequent misstep traders make is overfitting - tweaking strategies excessively to perfect backtests. While this might look impressive on paper, it often makes the strategy unreliable in live markets. In fact, up to 90% of "profitable" backtests suffer from errors like overfitting or look-ahead bias. To avoid look-ahead bias, ensure no future data, such as a closing price, influences earlier decisions.
Another overlooked factor is transaction costs, including slippage and commissions, which can significantly impact performance. Then there's survivorship bias, where traders test only on active assets, ignoring delisted or failed companies, which inflates historical results. On the psychological front, traders often externalize failure, blaming "the algos" or market makers instead of objectively reviewing their decisions. Mistaking short-term wins for skill or drawing conclusions from too few trades (less than 100–200) are other common errors.
"If you torture the data long enough, it will confess to anything." – Ronald Coase
To counter these pitfalls, employ out-of-sample testing. Split your data into "In-Sample" for optimization and "Out-of-Sample" for validation, ensuring no adjustments are made based on OOS results. Look for parameter plateaus, where performance remains consistent across a range of values, instead of chasing a single "magic number". Stress test your model by increasing slippage and commissions by 1.5–2× to verify robustness.
Once you’ve sidestepped these errors, focus on refining your feedback and review processes for continued improvement.
Maintaining Your Feedback Loop
Avoiding mistakes is just the start - keeping a steady flow of accurate feedback is what drives progress. Start by automating data collection. Manual tracking can be tedious, leading to incomplete records. Use journaling tools that sync directly with your broker for real-time, accurate feedback.
Accelerate your learning by increasing trade volume within your strategy. More trades mean more data, which speeds up the feedback loop and helps refine your approach. Incorporate walk-forward validation, where you use recent data (e.g., 12–18 months) to test your strategy on a future period, ensuring its stability over time.
Resist the urge to jump between strategies during losing streaks. Premature switching often stalls progress. Commit to a minimum sample size - at least 50–100 trades - before considering adjustments. Understand the difference between reinforcing loops, which encourage good habits like disciplined trading, and balancing loops, which curb bad habits like emotional decision-making.
Finally, reserve a holdout dataset - keep 15–20% of your historical data untouched until the final stages of strategy development. This serves as a "final exam" to validate your approach without the risk of overfitting.
A well-maintained feedback loop ensures that your daily efforts align with long-term growth and strategy refinement.
Connecting Feedback to Long-Term Results
Feedback loops aren't just for fixing errors - they're about creating a repeatable system that delivers results consistently. Research shows that backtesting can boost strategy performance by up to 30%, while disciplined backtesting reduces loss risk by 15% for new traders. Over 70% of traders use backtesting to evaluate strategies, and 80% report increased confidence in their decisions as a result.
Platforms like For Traders simulate real-world trading conditions, including daily loss limits and realistic execution rules. These tools help bridge the gap between backtesting and live trading by enforcing discipline through automated rules. Demo accounts and customizable settings allow traders to test adjustments safely before committing real money.
To measure success, focus on risk-adjusted metrics like the Calmar Ratio (CAGR divided by Maximum Drawdown), which evaluates a strategy's performance across different market conditions. Track progress over meaningful sample sizes. Studies show that strategies published in academic journals see returns drop by 26% out-of-sample and 58% after widespread replication. Only 1 in 20 strategy ideas typically survives rigorous validation to reach live trading.
"Backtesting is not a way to predict the future. It is a way to prevent obvious mistakes." – Finaur
Conclusion: Building Better Trading Habits Through Feedback
Improving your trading habits relies on consistently using a feedback loop to refine your approach. It's not a one-time adjustment but an ongoing process that sets disciplined traders apart. This cycle involves four key steps: Planning (setting your rules), Executing (placing trades), Analyzing (keeping a detailed journal), and Refining (making adjustments based on data). By following this method, trading shifts from unpredictable guesswork to a structured, measurable system where every decision is reviewed and improved.
Regular reviews - whether daily, weekly, or monthly - are essential for maintaining a sharp strategy. A Harvard Business School study shows that deliberate reflection can improve performance by nearly 23%, illustrating how small, consistent improvements add up over time. This habit of disciplined reviews naturally leads to better trading behaviors.
Rather than focusing solely on outcomes, prioritize process goals. The market reflects your readiness, patience, and emotional state. As TraderGav explains:
"Every trade carries two outcomes: financial and intellectual. You can lose money and still gain clarity".
Your trading journal should act as a business ledger, capturing the reasoning behind each decision. This turns raw data into actionable insights that guide your growth.
Platforms like For Traders provide tools to support this continuous improvement cycle. From simulated trading challenges and customizable rules to educational resources like video courses and e-books, For Traders offers a risk-free environment to test and refine your strategies. Their real-time feedback tools, automated risk management, and community support through Discord help ensure accountability as you work on your approach.
To make the most of these tools, track your progress daily. Rate your discipline on a scale of 1–10, focus on eliminating one mistake each week, and automate your data collection to get instant feedback. As Rolf from Edgewonk wisely puts it:
"The journey to consistent trading success isn't a sprint; it's a marathon".
Start building your feedback loop today, and let small, steady improvements lead to long-term success.
FAQs
How do I know if my strategy is broken or I’m just in a normal losing streak?
When trying to figure out if you're dealing with a flawed strategy or just a typical losing streak, start by considering the odds of consecutive losses. Losing streaks happen, even with strategies that usually win more often than not. The key is to assess whether your approach still provides an advantage or if market dynamics have changed. Pay attention to patterns - are setups that used to work now failing consistently? Identifying these shifts can help pinpoint the root of the issue.
What’s the minimum number of trades I should review before changing my rules?
When evaluating trades, there's no strict minimum number to review. However, to spot meaningful patterns and assess reliable performance metrics, you'll need to analyze enough trades to avoid being swayed by short-term ups and downs. Typically, this means reviewing several dozen trades to ensure your data is consistent. Aim for a sample size large enough to give you confidence in the trends before making any adjustments.
How can I test a strategy tweak without risking real money?
To refine your trading approach, you can use backtesting and forward testing. Backtesting involves running your strategy against historical market data to see how it would have performed in the past. On the other hand, forward testing takes place in real-time market conditions using a demo account, allowing you to test the strategy without risking any actual funds. This step is crucial for spotting potential challenges like spreads, slippage, and execution errors before committing real money to your trades.
Related Blog Posts
Start Trading with For Traders
Join our platform to test your trading skills, trade virtual capital, and earn real profits. Access educational resources, advanced tools, and a supportive community to enhance your trading journey.
Start your Trading Challenge