Slippage Impact on Prop Trading Performance
Slippage in prop trading, explained with real numbers: how fills scale with account size, the slippage factor formula, and the truth about 'zero slippage'.
By Marcel Hambálek · Senior Trader, For Traders
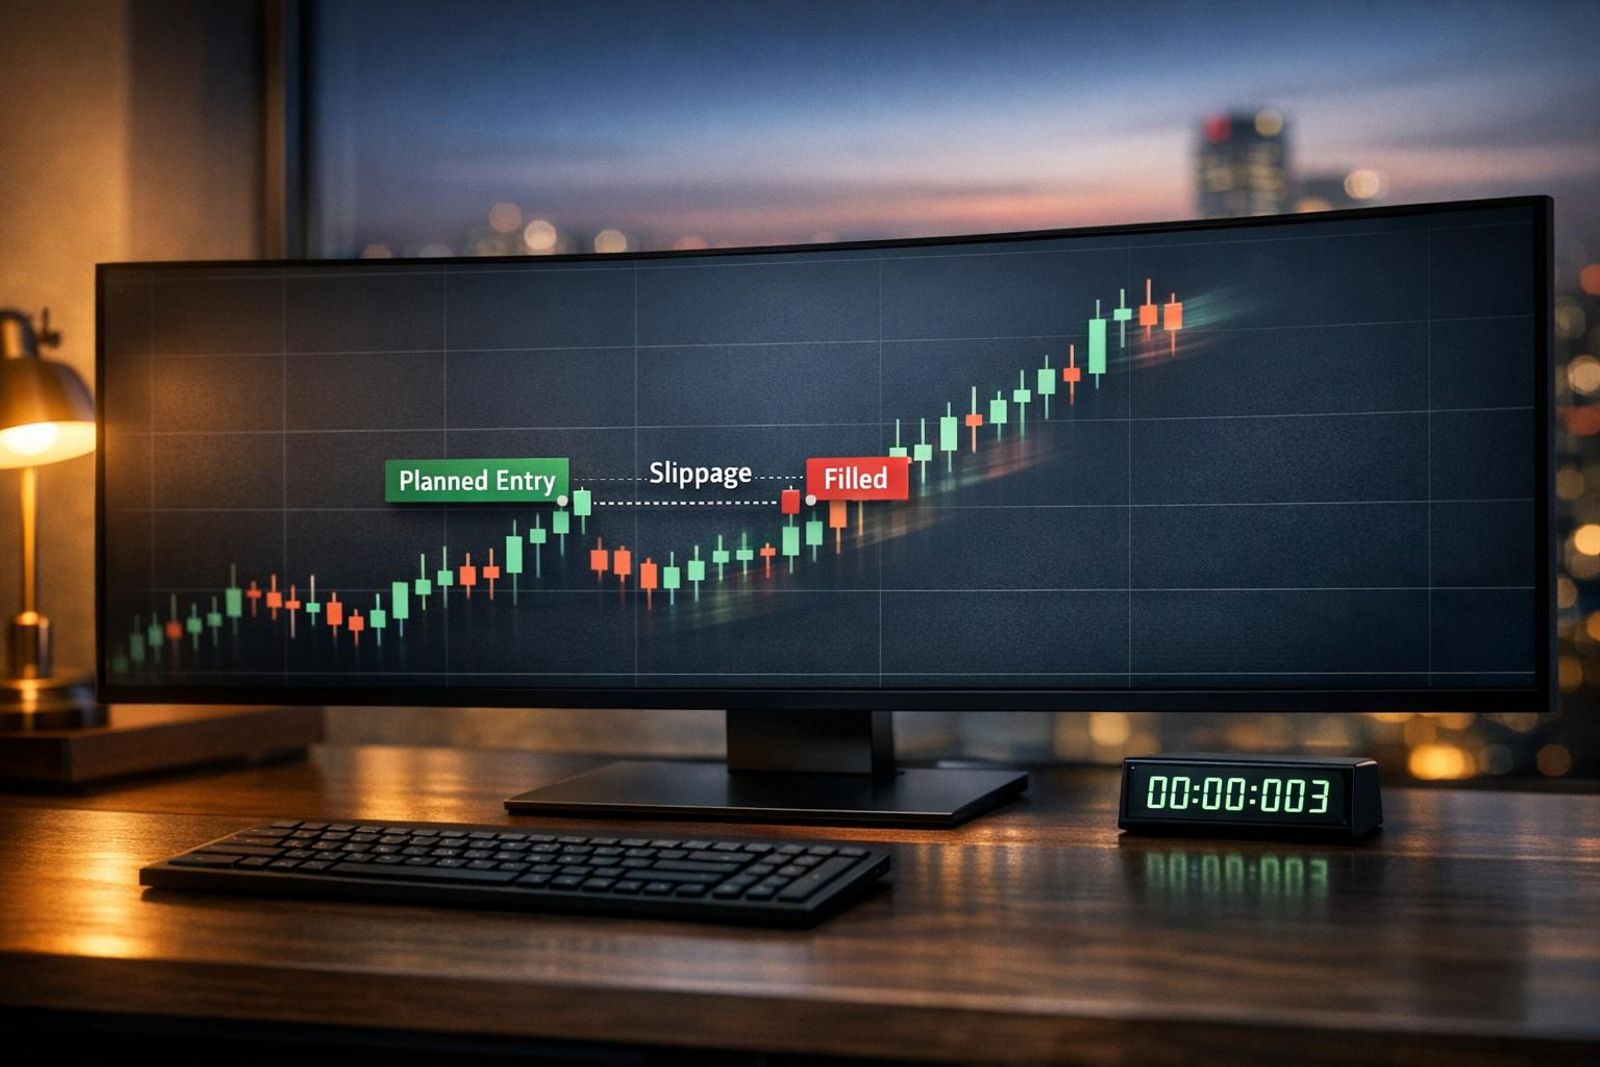
Slippage in prop trading is the difference between the price you clicked and the price you actually got, and it scales with order size, volatility and how thin the book is at that moment. No prop firm has zero slippage — the realistic question is how much slippage your strategy can absorb before its expectancy turns negative, which you can measure with a slippage factor of average slippage divided by average stop distance.
Key takeaways
- Slippage isn't random noise — it comes from volatility, latency and the execution model behind your fills, and each one is measurable.
- Slippage Factor = average slippage (pips) ÷ average stop distance (pips); anything above roughly 0.10 puts a scalping edge under serious pressure.
- A larger account slips more only when your lot size starts eating past top-of-book depth — 20 lots on XAUUSD is a different execution problem than 2 lots.
- No prop firm has zero slippage; 'zero slippage' marketing usually means simulated fills, requotes, or a fair-market-value clause that can reverse a fill later.
- Max deviation, limit and stop-limit orders, ATR-based stops and skipping the first 60–90 seconds after a release cut most avoidable slippage.
- Apply a 30–50% haircut to backtest results before you trust a strategy on funded capital, and size your stop buffer so a bad fill can't trip your daily loss limit.
Watch: related video
What Slippage Really Is (And Why It's Not Always Against You)
Slippage is the gap between the price you clicked and the price your order actually filled at. It runs both directions — negative slippage costs you, positive slippage pays you — and understanding that split is the first step in any prop firm slippage explained the right way, instead of treated as a black box that only steals pips.
Negative slippage means your buy fills higher or your sell fills lower than requested — the market moved against you in the milliseconds between click and match. Positive slippage is the mirror image: your buy fills lower, your sell fills higher, because liquidity moved in your favor before the fill confirmed. On a fair execution model, these should roughly offset over hundreds of trades. If your fills are negative almost every time, that's not "normal slippage in prop trading" — that's a red flag on the execution model itself.
The three causes: volatility, latency, execution model
Every slippage event traces back to one of three sources:
- Volatility — the bid-ask spread widening as market makers pull quotes during fast moves, so the "true" price shifts between your click and the match.
- Latency — the physical and network time between you hitting buy and the server confirming the trade. Even on a good connection this is 20-80ms; during high load it stretches further.
- Execution model — how your broker or liquidity provider routes and fills orders. A firm on true market execution passes through real book conditions; a dealing-desk-style model has more discretion over where your fill lands.
Where the spread ends and slippage begins
Traders routinely blame slippage for what was actually just a wide spread at entry. If you click during a moment when the bid-ask spread widening has already happened — say gold's spread jumps from 20 cents to 80 cents right before a release — you're paying spread cost, not slippage cost. Slippage is the extra distance between the quote you saw and the quote that existed by the time your order matched. Confusing the two makes you misdiagnose your own execution and blame the platform for a cost that was priced in before you clicked.
The clearest real-world lab for this is scheduled data: NFP, CPI, FOMC releases. Watch EURUSD or XAUUSD in the 150-300ms window around a release and 3-5 pips of movement is completely normal market behavior, not a broken platform. The same logic applies to the 5:00 PM EST rollover window, when major banks close out their books and liquidity thins out for a few minutes — spreads widen, and stops sitting at round numbers get picked off cheaply on volume that wouldn't move price at any other hour. Knowing these two windows exist changes how you size and place orders around them, which we cover in the risk section below.
How Slippage and Liquidity Affect Larger Trading Accounts
A $200k funded account doesn't get worse fills because of its balance — it gets worse fills because the position sizes that balance generates start consuming more than the top tier of the order book. Slippage on a large account isn't a punishment for account size; it's arithmetic. Once your order exceeds what's resting at the best price, the rest fills progressively deeper, and your execution price stops matching the quote you saw when you clicked.
Top-of-book depth vs your lot size
Every quote you see is really just the best price on offer — and only for a limited size. Order book depth is the list of prices and volumes stacked behind that top quote. If the best bid on XAUUSD holds 5 lots and you're selling 2, you fill entirely inside that top tier, likely inside the visible spread. Sell 20 lots into the same book, and you fill 5 at the top price while the remaining 15 walk into the second and third liquidity tiers — each one priced a little wider, because that's where the aggregated liquidity providers actually sit.
Walking the book: what a 20-lot XAUUSD order really does
Liquidity tiers exist because no single LP wants to hold unlimited risk at one price. Aggregators stack quotes from multiple providers, and each layer down gets progressively wider as deeper providers demand more compensation for the size. The result of walking through several tiers is a volume weighted average price (VWAP) — the blended fill price across every tier your order touched — that sits worse than the first quote you saw.
| Order Size (XAUUSD) | Tiers Consumed | Typical Fill Behavior | VWAP vs Quoted Price |
|---|---|---|---|
| 2 lots | Tier 1 only | Fills inside the spread | Matches or beats quote |
| 8 lots | Tier 1–2 | Partial walk into second tier | 0.5–1.5 pips worse |
| 20 lots | Tier 1–3 | Walks two to three tiers | 2–4 pips worse |
| 50+ lots | Tier 3+ | Meaningful book impact, possible partial fills | Highly variable, session-dependent |
When account size stops mattering and order size takes over
Here's the practical threshold: most traders clipping under 5 lots per order on majors or XAUUSD never see book-depth slippage — their orders simply don't have enough mass to move past the first tier. The problem shows up in the scale-up phase, exactly where funded traders live once they're managing larger simulated capital and sizing up accordingly. If you're stepping from a 2-lot habit into 15- or 20-lot clips because your account size now supports it, don't assume your backtested slippage numbers still hold. Re-test at your new size, or split large orders into smaller clips across the session to keep each slice inside the top liquidity tier.
The Slippage Factor: Measure Your Own Execution Cost
Slippage factor = average slippage (pips) ÷ average stop distance (pips). It's a single number that tells you what percentage of your risk gets eaten by execution before the trade even starts working — and it's the fastest way to know if your edge can survive the way you actually trade it.
The formula and a worked example
Say you run a scalp with a 12-pip stop, and your trade history shows an average slippage of 0.8 pips per fill. Calculate slippage factor as 0.8 ÷ 12 = 0.067. That means roughly 6.7% of your defined risk is gone before price has moved a single tick in your favor. On a 1:1.5 R:R setup that's not fatal. On a 1:1 scalp where you need every pip of edge, 6.7% off the top is the difference between a strategy that compounds and one that flatlines.
Auditing your trade history in MT4/MT5 or your platform report
You don't need third-party software for this — your broker's own trade report has everything.
- Export at least 100 filled market orders (limit and stop orders don't experience slippage the same way — filter them out, or they'll flatter your number).
- Pull the requested price (the price shown when you hit "buy" or "sell") and the actual fill price for each trade.
- Convert the difference to pips, keeping the sign (negative slippage against you, positive in your favor — average both, don't just average the absolute value or you'll hide a directional bias).
- Average the slippage column, then divide by your average stop distance in pips for the same 100 trades.
- Re-run this quarterly, and immediately after any jump in position size — the number moves with liquidity conditions and with your own order size.
One clarification worth making before you go further: some platforms use the term "CFD slippage factor" to mean something different — a broker-side slippage tolerance setting, essentially a deviation limit you configure that tells the server how far price can move before your order gets requoted instead of filled. That's a platform configuration. What we're describing here is a performance metric you calculate yourself from your own trade history. Same words, two different things — don't confuse a dashboard setting with your actual execution audit.
What a healthy slippage factor looks like by strategy type
- Under 0.05 — comfortable. Execution cost is a rounding error against your risk. Typical of swing and position trades with wider stops.
- 0.05–0.10 — workable. Most day-trading strategies with stops in the 15–30 pip range live here. Watch it, don't ignore it.
- Above 0.15 — your scalping edge is likely already dead, even if the backtest still looks clean. At this level slippage isn't a cost, it's a second spread you're paying on every single trade.
Slippage by Instrument: Gold, Indices, Forex and CME Futures
Slippage isn't a single number you can apply across your whole book — it's instrument-specific, and treating XAUUSD like EUR/USD will wreck your risk math. A EUR/USD market order during London hours typically fills sub-pip. That same order type on XAUUSD during the New York session can slip 20–50 cents. Index CFDs on US100/NSDQ gap hardest right at the cash open and close. Same order type, same platform, wildly different execution — because liquidity structure, not your broker's goodwill, is what determines your fill.
XAUUSD: why gold slips more than majors
Slippage in gold trading is structurally worse than in FX majors, and it's not because liquidity providers are picking on gold traders. Three things stack against you. First, XAUUSD's average true range relative to its typical spread is much wider than EUR/USD's — more distance for price to travel between the moment you click and the moment your fill confirms. Second, gold is LP-quoted, not exchange-quoted like a futures contract — there's no single central book, just an aggregation of liquidity provider streams that can thin out fast during news. Third, gold has heavy retail and prop-trader concentration around round numbers — 2,000, 2,050, 2,100 — so stops and orders stack right where the book is already thinnest. Put those three together and XAUUSD slippage during NFP or FOMC releases isn't an edge case, it's the expected case.
US100 / NSDQ: cash CFD spreads and index gaps
US100 NSDQ spreads on CFDs widen predictably around the 9:30 EST equity open — that's when the futures-to-cash basis resets and the underlying constituents start printing real trade prices instead of overnight indications. Index gap risk is real here: if you're holding a position through the open with a stop set on Sunday's close logic, you can wake up to a fill 15-20 points away from where you expected, because the market simply didn't trade at your stop price — it gapped through it. This is a different mechanism than gold's continuous-slippage problem; it's discrete and event-driven, tied to a specific clock time rather than to volatility in general.
CME futures order book vs CFD liquidity
CFD vs futures liquidity is the core structural difference worth understanding before you decide where to run size. A CME futures order book is a central limit order book — visible depth, tick-based fills, and you can literally see how many contracts sit at each price level before you send an order. A CFD has no visible book; you're getting a price from an LP aggregation layer, and what looks like "the market" is actually a composite quote. That means futures slippage is more mechanical — thin book, wide tick jump, no ambiguity about why — while CFD slippage can vary between providers even for the identical underlying and identical moment, because it depends on which LPs are quoting and how wide their spread went.
| Instrument | Order type | Typical slippage (normal session) | Typical slippage (high volatility) |
|---|---|---|---|
| EUR/USD | Market | 0–0.2 pip | 1–3 pips (NFP) |
| XAUUSD | Market | 3–8 cents | 20–50 cents (FOMC/NFP) |
| US100 (CFD) | Market | 1–3 points | 10–20 points (9:30 open) |
| CME futures (e.g. MNQ) | Limit at book | 0–1 tick | 2–5 ticks (thin book gaps) |
The practical takeaway: size your stop distance to the instrument's real slippage profile, not to a generic pip or point buffer copied from a different market.
Reduce Slippage on Market Open and Around News
Most avoidable slippage disappears with three changes: cap your max deviation, stop firing market orders into the first 60 seconds of a release, and stop parking stops on round numbers where the book is thinnest. None of this eliminates slippage — nothing does — but it converts random slippage into bounded, plannable slippage, which is the only kind your risk model can actually price.
Max deviation and slippage limits on quote-based orders
On a quote-based order (the standard for CFDs and spot gold), you're filled at the platform's quoted price plus or minus whatever deviation you allow. The max deviation setting — sometimes labeled "slippage tolerance" — tells the execution engine how far price can move between your click and the fill before it rejects the order instead of filling it at a worse price. Set it too wide (10+ pips on majors) and you're accepting whatever the book gives you during a spike. Set it too tight (0–1 pip) around NFP or FOMC and you'll get a wave of rejected orders — annoying, but often the correct outcome. A rejected order at a bad moment beats a filled order 15 pips from where you wanted in.
Most platforms also expose a partial-fill toggle. Leave it on for size you're comfortable scaling into gradually; turn it off if your strategy needs the full position filled together or not at all — a half-filled hedge is worse than no hedge.
Market, limit and stop-limit: choosing the right tool
Market orders guarantee execution, not price — that's the trade you're making every time you hit the button into a thin book. A stop-limit order flips the trade: it guarantees price, not execution. Around news, that's usually the better swap for exits you can afford to miss occasionally but can't afford to miss badly. The honest trade-off: a tight deviation cap on a stop-market exit means the stop can simply not trigger during a gap — you've swapped slippage risk for no-fill risk, not removed risk. Decide in advance which one you can live with for that specific trade, because you won't have time to decide mid-spike.
ATR-based stops and the first 60–90 seconds rule
Two directive habits fix most of the damage:
- Place stops 1.5× ATR beyond structure, not at the round number. Round numbers get hit first and get the worst fills because everyone's stop is stacked there.
- Wait 60–90 seconds after NFP, CPI or an FOMC statement before sending anything market-executed. Spreads on XAUUSD and US100 routinely widen 5–10x in the first tick and compress fast once the initial imbalance clears.
Pre-place limits at your planned entry instead of chasing the breakout candle — you either get filled at your price or you don't trade, which is a far better outcome than chasing a candle that's already moved 20 points against you.
| Setting | Tight (news-safe) | Wide (execution-first) | Best used for |
|---|---|---|---|
| Max deviation | 0–1 pip / 1–2 ticks | 5–10 pips / 5+ ticks | Tight: exits near news. Wide: guaranteed entries off-news. |
| Partial fill | Off | On | Off for hedges/pairs; on for scaling into size. |
| Order type | Stop-limit | Market | Stop-limit around FOMC/NFP; market in calm sessions. |
| Stop placement | 1.5× ATR off structure | Round number | ATR-based avoids the stop-hunt cluster. |
Ready to trade funded capital?
Choose your path — Instant Accounts, One-Step or Two-Step Challenges — from just $23, with up to $300,000 in funded capital.
Choose your challengeHow to Execute a Large Trade With Low Slippage
You execute a large trade with low slippage by never feeding the market more size than the top-of-book can absorb at once, laddering limit orders instead of firing a single market order, and choosing the session where depth is deepest for that instrument. Size is the enemy of price — a 20-lot gold order dropped into a thin book doesn't get one price, it gets a staircase of worsening fills, and the average of that staircase is your slippage.
Splitting and laddering: clip size vs top-of-book depth
Look at your depth-of-market ladder before you click anything. If the top tier on XAUUSD shows 3-4 lots resting at the best price, sending a 20-lot market order guarantees you walk down through five or six price levels before the order fills. Split it instead: 4-5 clips of roughly 4-5 lots each, spaced out rather than stacked. This is order splitting in its simplest form — the same logic institutional desks use with an iceberg order, where only a slice of the total size is visible to the book at any moment while the rest sits hidden and refills automatically as each slice executes.
For discretionary execution without iceberg functionality, ladder limit orders 3-5 ticks apart around your intended level instead of one aggressive market order. You're trading a few points of potential missed fill for a materially better average entry — worth it on anything above a handful of lots.
Time-weighted entry and choosing the deepest session
Spread size execution over 60-120 seconds rather than one instant. A time-weighted entry — legging in every 15-20 seconds — lets the book replenish between clips instead of forcing liquidity that isn't there. Pair this with session timing: for FX, that's the London/New York overlap (roughly 13:00-16:00 GMT), where spreads compress and depth is at its daily peak. For US indices like NSDQ, stick to NY cash hours — the pre-market and post-close books are thin and gap-prone. For gold size specifically, avoid the Asian session; XAUUSD liquidity there is a fraction of London/NY hours, and the same clip that fills clean at 14:00 GMT can slip several dollars at 02:00 GMT.
Latency, VPS and co-location — what actually moves the needle in 2026
Retail execution typically runs a round-trip of ~150-250ms from a home connection to the broker's server. A low latency VPS co-located at a hub like LD4, NY4 or Equinix cuts that to sub-1ms. Honest framing matters here: this gap is decisive for high-frequency scalping, where a 200ms delay during a fast NFP tick can be the entire difference between your intended price and your fill. For a swing trader holding a position for two or three days, execution speed and slippage on CFD platforms barely correlate — the few milliseconds saved on entry are irrelevant against a multi-day price target. Spend the co-location budget only if your holding period is measured in seconds or minutes, not days.
Is There a Prop Firm With Zero Slippage? The Honest Answer
No. If you've been searching "prop firm with zero slippage" or "which prop firm has no slippage," the honest answer is that none exists — any program claiming it is either quoting a smoothed simulated feed, reserving the right to requote, or hiding behind a fair-market-value clause that lets it adjust or void your fill after the fact. Slippage is a function of liquidity and latency, not marketing copy. The real question isn't which firm eliminates it — it's which firm's simulation reproduces it honestly.
What "zero slippage" marketing usually means
When you see "zero slippage execution" on a landing page, it almost always describes one of three things: a demo server that fills every order at the exact requested price regardless of market conditions, a dealing desk that internalizes flow and simply prints the price you asked for, or a promotional claim that only applies to limit orders filled at your price or better (which isn't slippage protection — that's just how limit orders work). None of these describe how a live account, funded or otherwise, actually trades against real liquidity. Read it as a signal to check the fine print, not a feature to bank on.
Simulated fills, requotes and fair-market-value clauses
Every challenge — at For Traders or anywhere else — runs on simulated capital, so the fills you get during evaluation are, by definition, a model of the market, not the market itself. The mechanism to scrutinize is how good that model is. A demo feed that never slips on NFP, never requotes during a Fed statement, and always fills your stop at the exact price you set is training you on conditions that don't exist live. That's a worse outcome than a bit of realistic slippage — it's a false edge you'll discover the hard way once real spreads widen.
Two clauses to hunt for in any prop firm's terms and conditions before you fund a challenge:
- Requote clauses — the firm can offer you a new price instead of filling at your requested price, typically during high volatility or thin liquidity windows.
- Fair-market-value / erroneous-fill clauses — the firm reserves the right to adjust, cancel, or void trades executed at prices deemed "off-market," including during spikes or feed errors. This is standard across the industry, not a red flag by itself — but you need to know it exists before you build a strategy around exploiting an unusually generous fill.
A-Book vs B-Book: which model you're actually trading on
In A-Book / STP / ECN routing, your order actually touches liquidity provider (LP) quotes, so slippage is genuine — it reflects real spread widening and real order-book depth at the moment you clicked. In B-Book market-maker execution, the counterparty is internal, which means fills can look suspiciously clean in calm conditions, then produce sudden requotes the instant volatility spikes, because there's no external liquidity absorbing the shock. Neither model is inherently dishonest, but a program that's vague about which one underlies its simulated pricing is a program you should question — ask directly, and check whether the answer shows up anywhere in their execution disclosures.
Slippage-Adjusted Expectancy: When Your Edge Actually Dies
Recalculate your expectancy with slippage subtracted from every entry and exit, not just the losers — a strategy that looks robust on a backtest can lose most of its edge once realistic fills are priced in, and the gap between clean and live numbers is exactly why so many traders pass a challenge on paper logic and then bleed out on execution.
The expectancy formula with a slippage line item
Standard expectancy: (Win% × Avg Win) − (Loss% × Avg Loss). Take a strategy with an 8-pip average win, 6-pip average loss, and a 55% win rate. Clean expectancy = (0.55 × 8) − (0.45 × 6) = 1.7 pips per trade. That's a real edge, comfortably above the 42.9% breakeven win rate this R:R requires.
Now add 1.5 pips of round-trip slippage — a modest, realistic number on a mid-liquidity pair during normal hours. Slippage shaves your winners and widens your losers, because it hits you unfavorably on both the entry and the exit. Your effective average win drops to 6.5 pips, your effective average loss grows to 7.5 pips. Recalculate the R:R after slippage: breakeven win rate jumps to 7.5 / (6.5 + 7.5) = 53.6%. Your 55% win rate now clears the bar by 1.4 percentage points instead of 12. New expectancy: (0.55 × 6.5) − (0.45 × 7.5) = 0.2 pips per trade — a 88% collapse in edge from a slippage figure most traders would call negligible. Run your own numbers through this exact formula before you trust a backtest.
Backtest-to-live haircut: 30–50% and why
The backtest to live slippage haircut isn't a myth traders invented to explain losses — it's a structural fact of execution. Historical backtests fill at the quoted price with no queue, no latency, no news-driven book withdrawal. Live fills carry all three. Across most retail and prop execution studies, live results land 30–50% worse than clean historical performance once slippage, requotes and partial fills are counted. That haircut doesn't distribute evenly either — it concentrates in your best trades, because those are usually the fast-moving breakouts where the book thins out fastest. The result is Sharpe degradation: your return stream doesn't just shrink, it gets choppier, because the tail-risk trades that used to pad your average now cost you instead. A high turnover strategy drag compounds this — the more round turns you take, the more times you pay the haircut, and scalping or grid systems can see 3–5% of annual return eaten by execution alone, separate from the strategy's actual signal quality.
The annual cost of spreads, commissions and slippage
Pip-by-pip, execution cost feels abstract. Annualized on a funded account, it isn't.
| Cost component | Per round turn | At 500 trades/year |
|---|---|---|
| Spread (EUR/USD, average) | 0.8 pips | 400 pips |
| Commission (standard lot equivalent) | ~0.7 pips | 350 pips |
| Slippage (realistic round-trip) | 1.5 pips | 750 pips |
| Total trading cost per year | 3.0 pips | 1,500 pips (~$15,000 on 1 lot avg) |
On a $100,000 funded account trading roughly one standard lot per position, that's a 15% annual drag before your strategy has generated a single dollar of direct
Slippage vs Drawdown Rules: The Risk Nobody Prices In
On an equity-based daily loss limit, the number that matters isn't your intended stop — it's your filled price. A slipped stop gets counted at whatever price you actually got out, which means execution risk is drawdown risk, not a separate line item you can ignore. Traders who size to the edge of their limit find this out the expensive way.
Equity-based drawdown and the fill that trips it
Most prop challenge risk rules calculate your daily loss limit on floating equity, not just closed trades — so a bad fill during a live position gets marked against you in real time. Do the arithmetic: you're sized to lose exactly 4.8% against a 5% daily limit, running what looks like a clean, calculated risk. Then NFP prints, your stop gets filled 0.5% worse than intended, and you're through the limit before you've even processed what happened. There was zero room built in for execution variance, because the position sizing assumed a perfect fill that was never guaranteed.
The fix is mechanical, not emotional: build a stop buffer of roughly 5 pips on volatile instruments like XAUUSD or NSDQ around known volatility windows, and size your risk to 50–60% of the stated daily limit as a personal circuit breaker. That gap isn't wasted risk capacity — it's the margin that absorbs the slippage your strategy will eventually experience, because it always does.
Static vs trailing max drawdown under bad fills
Static and trailing max drawdown rules react very differently to a bad fill, and the difference matters more than most traders realize until they've lived it. Under a static max drawdown, your floor is fixed against the initial balance — a slipped fill hurts, but the boundary doesn't move on you. Under a trailing max drawdown, your buffer follows your equity peak upward, which means a bad fill on what should have been a winning day can lock in a worse floor right when you need room to breathe. You bank an unrealized gain, price gaps against you on the exit, the trail resets to a level tighter than you planned for, and now you're managing risk against a ceiling that shrank at the worst possible moment. Know which structure your account runs on before you size a single trade near either limit.
The perfect-fill illusion and revenge trading
Clean demo conditions build a false expectation: every backtest fill, every practice run, executes at the price you clicked. Real markets don't extend that courtesy, and the first ugly fill on a live challenge often does more psychological damage than the slippage itself. One bad execution triggers the urge to "get it back" — bigger size, tighter patience, a trade that ignores your own plan. That's the revenge-trade spiral, and it's the actual account killer, not the fractional percentage lost to the fill that started it. Trading psychology after a bad fill is a discipline in itself: acknowledge the slip, close the position mentally, and refuse the next trade until you're sized and calm again. The traders who survive evaluations aren't the ones who never get slipped — they're the ones who don't let one fill turn into three.
Ready to trade funded capital?
Choose your path — Instant Accounts, One-Step or Two-Step Challenges — from just $23, with up to $300,000 in funded capital.
Choose your challengeIs It Worth Switching CFD Platforms Purely for Execution Speed?
Pros
- Sub-pip improvement per round turn compounds meaningfully for scalpers doing 20+ trades a day
- Deeper LP aggregation reduces book-walking on larger clips, which matters as you scale account size
- Better platform tooling — max deviation caps, partial fills, stop-limit support — removes avoidable slippage outright
- Transparent fill reporting lets you calculate a real slippage factor instead of guessing
Cons / risks
- Rebuilding indicators, templates and muscle memory on a new platform costs weeks of consistency
- Marketing claims about execution speed are rarely verifiable before you fund and trade
- For swing and position traders holding hours to days, a 100ms improvement is statistically irrelevant
- Chasing execution is a common way to avoid fixing a strategy that has no edge to protect
Frequently Asked Questions
What is slippage in prop trading?+
Slippage is the difference between the price you click and the price your order actually fills at, caused by the market moving in the milliseconds between order submission and execution. It happens on any electronic trading platform, not just prop challenges, and gets worse during low liquidity or high-volatility windows like NFP or FOMC. On a funded account, slippage matters more than casual trading because it eats into your daily loss limit and max drawdown calculations. A few pips of consistent negative slippage on XAUUSD or NSDQ can turn a marginal edge into a losing one over enough trades.
Is there a prop firm with zero slippage?+
No electronic trading platform offers true zero slippage — every fill depends on live liquidity, and claiming otherwise is a red flag rather than a feature. What reputable firms actually offer is tight execution around a fair reference price, transparent fill reports, and reasonable max deviation settings so orders reject rather than fill far off-market. When you see "zero slippage" marketing, check the fine print for fixed spreads on demo simulation versus what happens during real volatility spikes. For Traders discloses its execution model and simulated liquidity conditions rather than promising an impossible outcome.
How do slippage and liquidity affect larger accounts?+
Larger position sizes need deeper liquidity to fill at one price, so a $200k account trading the same instrument as a $10k account can see wider slippage on the same order because it has to walk further through the order book. This is most visible on lower-liquidity futures contracts or during thin sessions, less so on XAUUSD and major indices which carry deep volume most of the day. The fix isn't avoiding size — it's splitting larger orders, timing entries around liquidity windows, and using limit orders instead of market orders when the setup allows it.
What is a slippage factor in CFD trading?+
A slippage factor is a multiplier or percentage you apply to your average slippage per trade to estimate its cumulative cost over a strategy's sample size. Calculate yours by comparing intended entry price to actual fill price across your last 50-100 trades, averaging the difference in pips or ticks, then converting to account currency using your typical lot size. If your backtested edge assumes zero slippage but your live factor is eating 0.3R per trade, that gap is often the real reason a profitable-on-paper strategy fails a funded evaluation.
How can I reduce slippage at market open?+
Avoid market orders in the first few minutes after open — spreads widen and liquidity is thin, so even a small order can fill several pips off your intended price. Use limit orders with a defined price instead of market orders, set a max deviation or slippage tolerance in your platform settings, and consider waiting for the first 5-15 minute candle to close before entering breakout setups. Splitting a larger position into smaller clips filled over a few minutes also reduces the average slippage per unit compared to one large market fill.
How do brokers manage slippage during high volatility?+
During high-volatility events like FOMC or NFP, liquidity providers widen spreads and may requote or reject orders that exceed their max deviation threshold rather than fill at a stale price. Some platforms pause new order entry for seconds around major news releases specifically to manage this risk. As a trader, expect wider fills during these windows regardless of platform quality — the realistic move is reducing size or standing aside for the first few minutes rather than assuming any provider can eliminate volatility-driven slippage entirely.
How do I execute a large trade with low slippage?+
Split the position into smaller clips filled over several minutes instead of one market order, use limit orders anchored near the current bid/ask, and trade during peak liquidity hours for that instrument — London/New York overlap for FX and gold, regular trading hours for CME futures. An iceberg-style approach, where you only expose part of your intended size at a time, reduces the market impact that causes slippage on size. Time-based entries around known liquidity spikes, rather than reacting instantly to a signal, also improve average fill quality on larger orders.
Does slippage differ between gold, indices, and futures?+
Slippage behaves differently across asset classes because each has its own liquidity depth and trading hours — XAUUSD generally sees tighter, more consistent fills given its status as the most-traded instrument on many platforms, while CME futures can show wider slippage around contract rollover or outside regular trading hours. US indices like NSDQ tend to slip more sharply during the first and last minutes of the cash session. Knowing these patterns for your specific instrument matters more than generic slippage advice when you're sizing entries on a funded account.
How much does slippage cost a trader per year?+
For an active trader placing several trades a day, slippage combined with spread and commission can quietly cost several percentage points of account equity annually, even when the raw strategy edge looks solid on paper. The exact number depends on trade frequency, instrument liquidity, and order type — a scalper on a volatile instrument pays far more than a swing trader using limit orders on gold. Tracking your real fill data against intended entries for a month gives a far more honest cost estimate than any generic industry average.
Is switching platforms for execution speed worth it?+
It's worth it only if you've measured a real, consistent slippage gap on your current platform that's costing more than the friction of switching — new platform learning curve, data feed differences, and rebuilding your workflow. Before switching, log your actual fills against intended entries for a few weeks to confirm the problem is execution and not order type, timing, or instrument choice. If the data shows a genuine edge-eroding pattern, faster execution and tighter max deviation settings on a new platform can meaningfully protect a strategy's real-world edge on a funded account.
Written by
Marcel Hambálek
Senior Trader, For Traders
Marcel trades Futures and Forex day-trading setups on funded accounts and writes about the executional details most traders skip — order types, slippage, session timing, platform quirks on MT5 and NinjaTrader. Pragmatic, mechanics-first, no fluff.
Follow on LinkedInReady to trade funded capital?
Choose your path — Instant Accounts, One-Step or Two-Step Challenges — from just $49, with up to $300,000 in funded capital.
Choose your challengeTrade up to $300,000
Choose challenge