
Want to improve your trading performance? MyFXBook and FX Blue are two tools that can help you monitor, analyze, and refine your trading strategies. Both platforms connect directly to your MetaTrader accounts, providing detailed insights into profit, drawdown, win rate, and other key metrics. Here's what you need to know:
- MyFXBook: Best for third-party verification and tracking long-term performance. It’s great for building credibility with potential investors or prop firms.
- FX Blue: Offers unique features like a trading simulator for manual practice using historical data and real-time equity tracking. If you prefer a different interface, TradeLocker for prop firm beginners also provides robust performance tracking.
Both are free to use and essential for traders navigating prop firm rules and challenges or aiming for consistent growth. Below, we’ll dive into setting up these tools, tracking key metrics, and using them to refine your trading strategy.
Setting Up and Connecting Your Accounts
Creating Your MyFXBook and FX Blue Accounts
Getting started with MyFXBook and FX Blue is simple and free, making it an ideal setup for prop trading for beginners. To create a MyFXBook account, head to their homepage and use the "Quick Signup" option. You'll need to select a username, provide a valid email address, and set a password. Once you've submitted your information, check your email for the activation link to complete the process.
For FX Blue, the process is just as easy. Register for an "FX Blue Live" account directly on their website. One handy feature of FX Blue is the ability to create multiple usernames under the same email address .
Connecting Your For Traders Demo Accounts

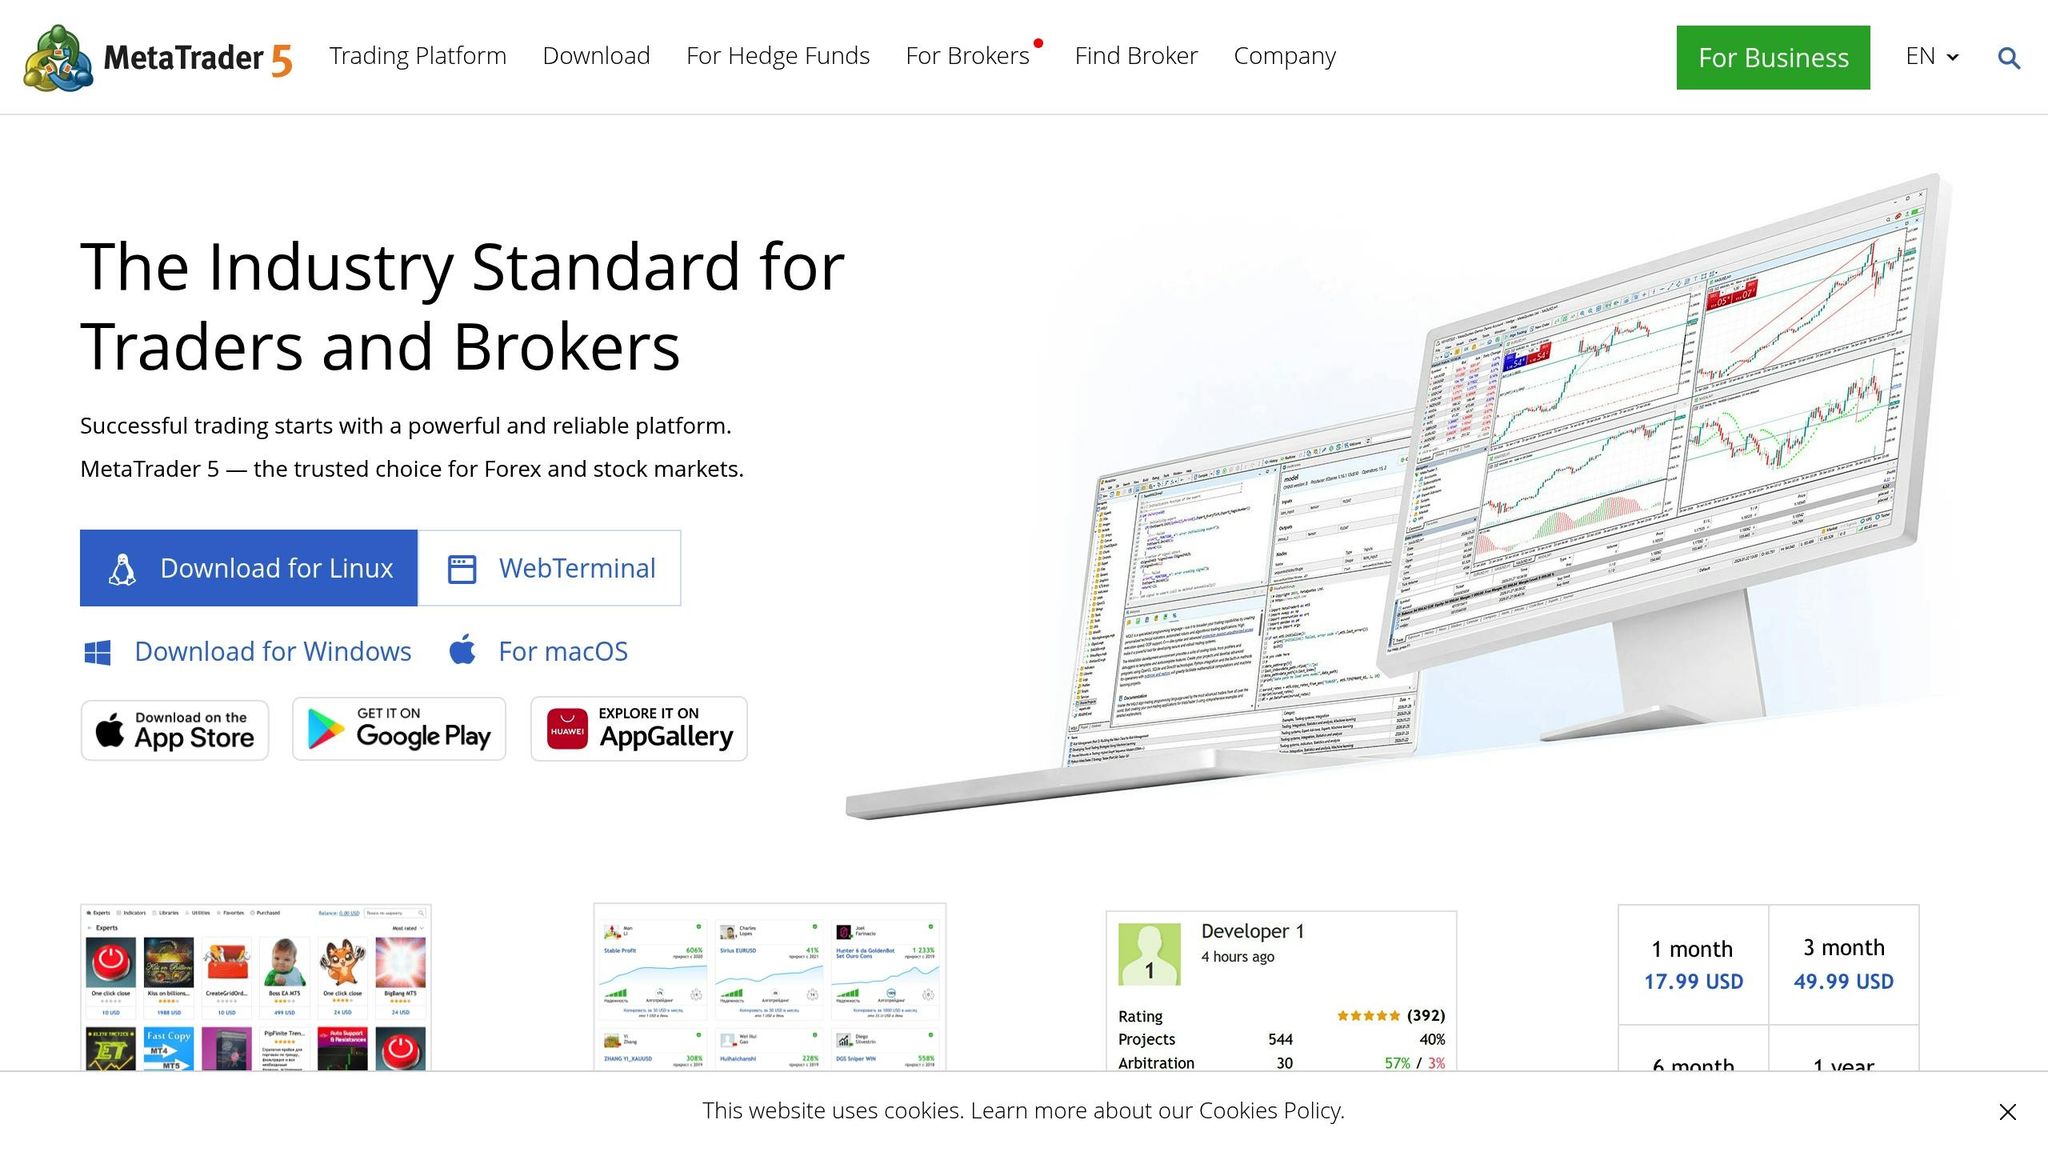
When participating in For Traders challenges, the Auto Update method is the preferred way to connect your accounts. To set this up in MyFXBook, navigate to Portfolio > Add Account, select your MetaTrader 4 or MetaTrader 5 version, and fill in details like your broker name, server name (e.g., "ForTraders-Demo"), account number, and investor (read-only) password.
"Myfxbook systems will connect directly to your broker several times a day to verify your results." - MyFXBook
The investor password is crucial because it allows read-only access, safeguarding your account from unauthorized trades. If you don't know your investor password, you can reset it in MetaTrader by going to Tools > Options > Server > Change. Always use the investor password instead of the master password for better security.
For FX Blue, there are two connection options: the Publisher EA method or account sync. If you choose the Publisher EA method, download the necessary software from FX Blue's website and install it in your MetaTrader data folder. After installation, drag the "FX Blue - Publisher" script from the Navigator onto an empty chart. Then, enter your FX Blue credentials in the "Inputs" tab and enable "Allow DLL imports" in the "Dependencies" tab. Once everything is set up, the chart will turn blue and show a success message, confirming the connection .
Once your accounts are linked, you’ll be ready to monitor essential metrics for your prop trading performance.
[MyFXBook] Connect to Metatrader 4 (MT4) - [Verify Trading Privileges and Share Myfxbook]
Key Metrics to Track for Prop Trading

Professional Trading Metrics Benchmarks for Prop Traders
Once you've connected your accounts, the next step is to focus on the metrics that truly matter in simulated prop trading. Platforms like MyFXBook and FX Blue provide detailed dashboards to monitor key indicators such as profit growth, risk exposure, and returns - essential tools for assessing your trading performance.
Profit and Gain Analysis
Start by looking at your percentage-based gain, which shows how much your account has grown compared to its initial balance. For example, if a $10,000 account grows to $11,500, that's a 15% gain. Another critical metric is the Profit Factor, calculated by dividing total gross profit by total gross loss. Here's how to interpret it:
- Below 1.0: Losses
- 1.1–1.4: Average
- 1.5–2.0: Strong
- Above 2.1: Exceptional
For instance, in September 2025, professional trader Diego Arribas Lopez evaluated the "DoIt GBP Master" strategy, which achieved a Profit Factor of 2.14, showcasing its efficiency. Another important measure is the Risk-Adjusted Return, calculated as (Annual Return - Risk-Free Rate) divided by Maximum Drawdown. Values above 3.0 indicate strong performance, while anything above 5.0 is outstanding.
"The win rate and total profit tell you almost nothing about an EA's true quality."
– Diego Arribas Lopez, Professional Trader
Analyzing gains goes hand in hand with understanding your drawdown, which we'll explore next.
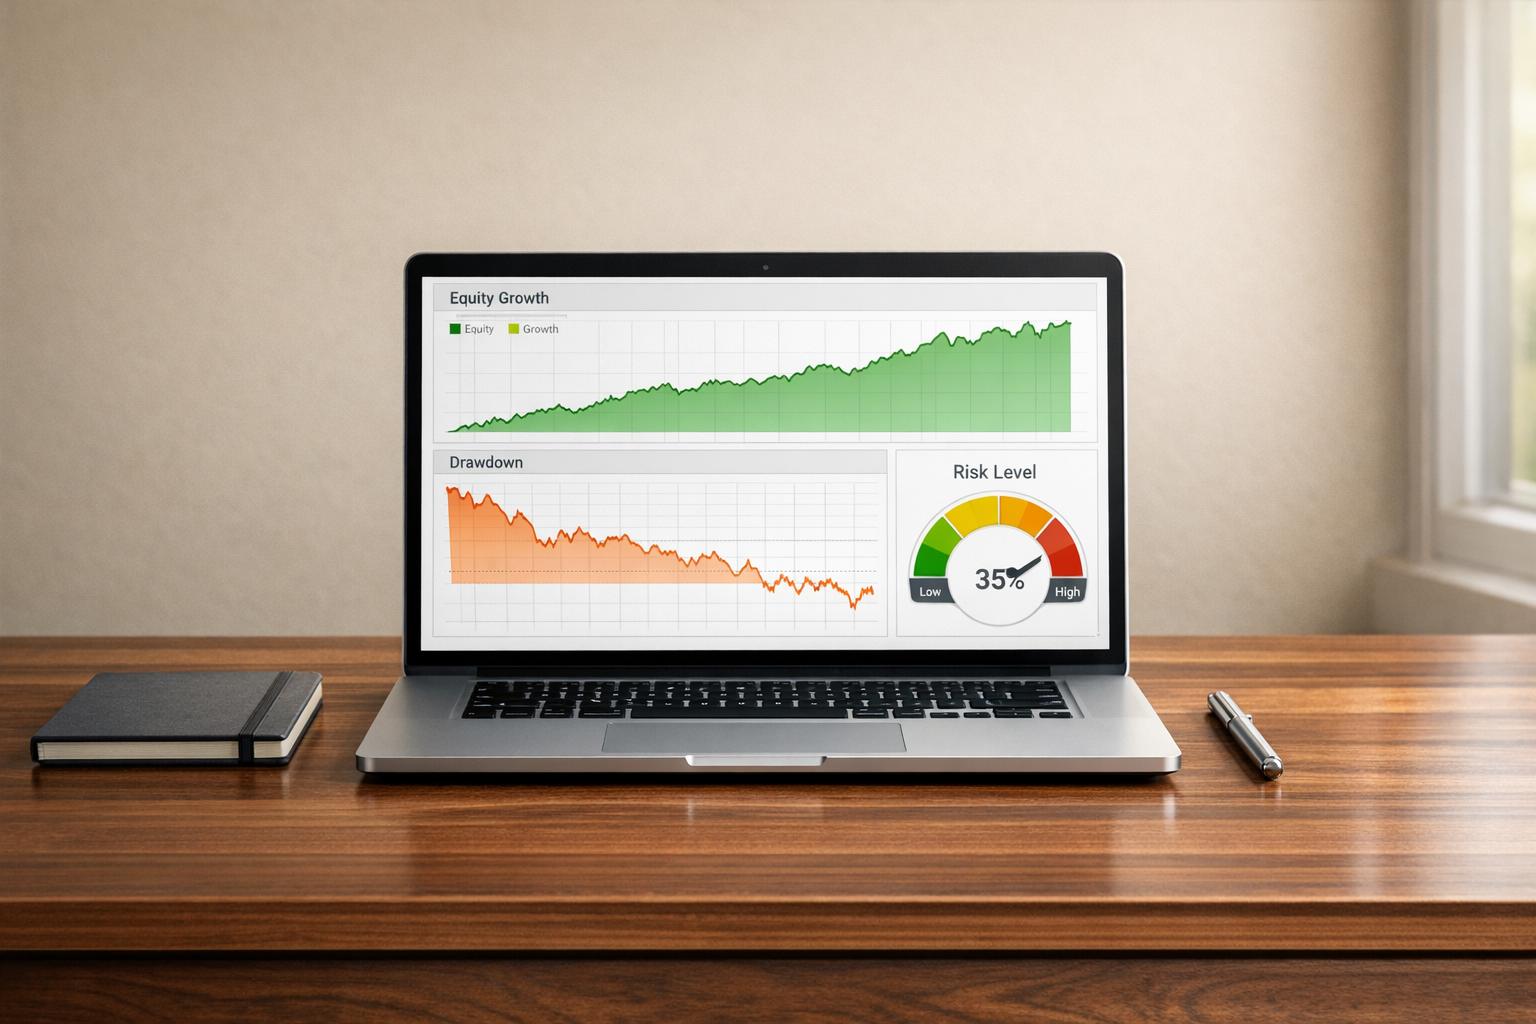
Drawdown and Equity Monitoring
Maximum Drawdown reveals the largest drop in your account's value from peak to trough - an essential measure for understanding the worst-case scenario you might face. Prop trading challenges often impose strict drawdown limits. For example, a $10,000 account with FundingPips has a maximum drawdown limit of -5%, while a $100,000 account with OneFunded allows up to -10%.
Tools like MyFXBook and FX Blue provide real-time drawdown tracking to help you stay within these limits. Another key metric is the Recovery Factor, which measures how effectively an account recovers from losses. It's calculated as net profit divided by maximum drawdown. The "DoIt GBP Master" strategy, for example, achieved a Recovery Factor of 7.3, highlighting its ability to rebound from setbacks.
Since many prop firms calculate drawdown based on equity (including both realized and floating profits or losses), keeping a close eye on your equity curve is essential. FX Blue Live updates account data as frequently as every 60 seconds, offering near real-time insights into your equity position.
| Metric | Professional Benchmark | Significance |
|---|---|---|
| Profit Factor | 1.5 – 2.0 | Efficiency for each dollar risked |
| Max Drawdown | 5% – 10% | Reality check on risk |
| Recovery Factor | 3.0 – 5.0 | Ability to recover from losses |
| Risk-Adjusted Return | > 3.0 | Return relative to risk |
These metrics form the foundation, but refining your strategy requires looking at trade-specific data.
Pips, Win Rate, and Expectancy
A high win rate might seem appealing, but it doesn't tell the whole story if your losses outweigh your wins. A better indicator is the Average Profit/Loss Ratio, which compares the size of your average winning trades to your average losing ones. A ratio of 1:2 is solid, while 1:3 is even better.
"By money management rules, your average profit must be higher than your average loss. A good ratio is 1:2 but a better one is 1:3."
– RoboForex Analysis
Another useful metric is the Z-Score, which helps determine whether your trading results are consistent or just random. A Z-Score of 99.99% indicates a high likelihood that a profitable trade will be followed by another, potentially justifying increased trade volumes during winning streaks.
Finally, consider your Average Trade Duration, which reveals your trading style - whether you're scalping or swing trading. This matters because some prop firms restrict trades over weekends or during major news events, and scalping requires low spreads and minimal latency. Reviewing the balance between long and short positions can also highlight strategic gaps. For example, if only 20% of your long trades are profitable, it might be time to adjust your approach.
Using Trade Analytics to Improve Performance
Understanding your trading metrics is crucial, but putting them into action is where the real value lies. Platforms like MyFXBook and FX Blue go beyond basic profit and loss summaries, offering in-depth analytics to help you pinpoint what works in your strategy - and what doesn’t.
Analyzing Trade History and Strategy Performance
The first step in improving performance is breaking down your trades into specific criteria. For example, FX Blue allows you to filter trades by currency pairs, helping you identify which ones are driving profits. If EUR/USD consistently generates gains while GBP/JPY underperforms, it might be worth pausing trades on the weaker pair until you fine-tune your approach.
Another powerful tool is Strategy Tags, which let you group trades by specific methods. Adding notes like "breakout" or "scalping" when placing orders allows you to later evaluate the success of each approach. Take the "happy_martigrid_real" account on FX Blue as an example: over 1,695 days, it recorded 804 winning trades against 239 losses. While the win rate was high, the analytics revealed a key issue - average losses were -$8.14, compared to average wins of +$4.42. This imbalance in the risk-to-reward ratio highlighted a reliance on trade volume over trade quality. Such insights not only shed light on performance but also uncover areas where risk management can improve.
You can also use MAE (Maximum Adverse Excursion) and MFE (Maximum Favorable Excursion) to assess your stop-loss and take-profit settings. MAE shows how far a trade moves against you before it becomes profitable, helping you determine if your stop-loss is too wide. On the flip side, MFE reveals whether you’re exiting winning trades prematurely, leaving potential gains on the table.
FX Blue also lets you analyze trading performance by day and hour. For instance, you might discover that Friday trades consistently result in losses. Similarly, if 20% of your long positions are profitable but 80% of your short positions succeed, you might have a directional bias. In such cases, it’s worth focusing on setups where you have a clear edge or avoiding buy orders until your strategy improves.
These insights form the foundation for refining your risk management practices.
Evaluating Risk Management and Position Sizing
Effective risk management is just as critical as the strategy itself. Tools like MyFXBook’s Risk of Loss feature calculate the likelihood of reaching specific drawdown levels based on your trading history. For example, if the tool predicts a 90% chance of a 10% drawdown, consider reducing your position sizes by half to lower the risk to around 5%. Additionally, MyFXBook’s Length chart can highlight behavioral patterns, such as holding losing trades longer than winning ones. If this is a recurring issue, stricter stop-loss rules may be necessary.
FX Blue’s Trading Simulator offers a practical way to manage position sizing. By using its built-in calculators, you can determine the appropriate lot size for a fixed risk amount, like $100. For instance, you can Ctrl+click the stop-loss field to calculate the lot size needed to maintain consistent risk across all trades, no matter the currency pair or its volatility.
| Metric | How It Helps | Action to Take |
|---|---|---|
| Strategy Tags | Helps review and isolate different approaches | Remove or refine underperforming methods |
| MAE / MFE | Shows if stop-loss or take-profit levels need tweaking | Tighten stops or adjust profit targets |
| Risk of Loss | Estimates the likelihood of hitting drawdown limits | Reduce position sizes to manage risk |
| Length Chart | Highlights if losing trades are held too long | Enforce stricter stop-loss discipline |
Using MyFXBook and FX Blue with For Traders Challenges
Tracking your performance during a For Traders challenge is a must. Tools like MyFXBook and FX Blue make this easier by connecting directly to your demo accounts. You can do this using the Account Sync feature or by installing the publisher EA for MT4/MT5. Just make sure to enable "Allow DLL imports" in your Expert Advisor settings to keep data syncing smoothly. Once everything is set up, you'll get real-time updates on your balance, equity, and margin usage - key metrics for staying within the strict 5% max drawdown rule enforced by For Traders.
Monitoring Your For Traders Challenge Progress
The Account Analysis section on these platforms is a game-changer. It provides charts that show your balance trends and trade extremes, giving you a clear picture of whether you're on track to hit the 9% profit target required to pass the challenge. For instance, if you notice your equity curve flattening or dipping, it’s a signal to tweak your strategy before hitting drawdown limits. The drawdown tracking feature is particularly useful, as it monitors both daily and total drawdown percentages in real time.
"The Analysis section offers detailed visualisations of trading results, enabling traders to gain deeper insights into their performance." – FX Blue
To keep things organized, set up a dedicated FX Blue or MyFXBook account specifically for your For Traders challenge. This way, your performance data stays separate and easier to manage.
These tools don’t just help with strategy adjustments - they also prepare you for showcasing your performance to others.
Competing in Trading Competitions and Leaderboards
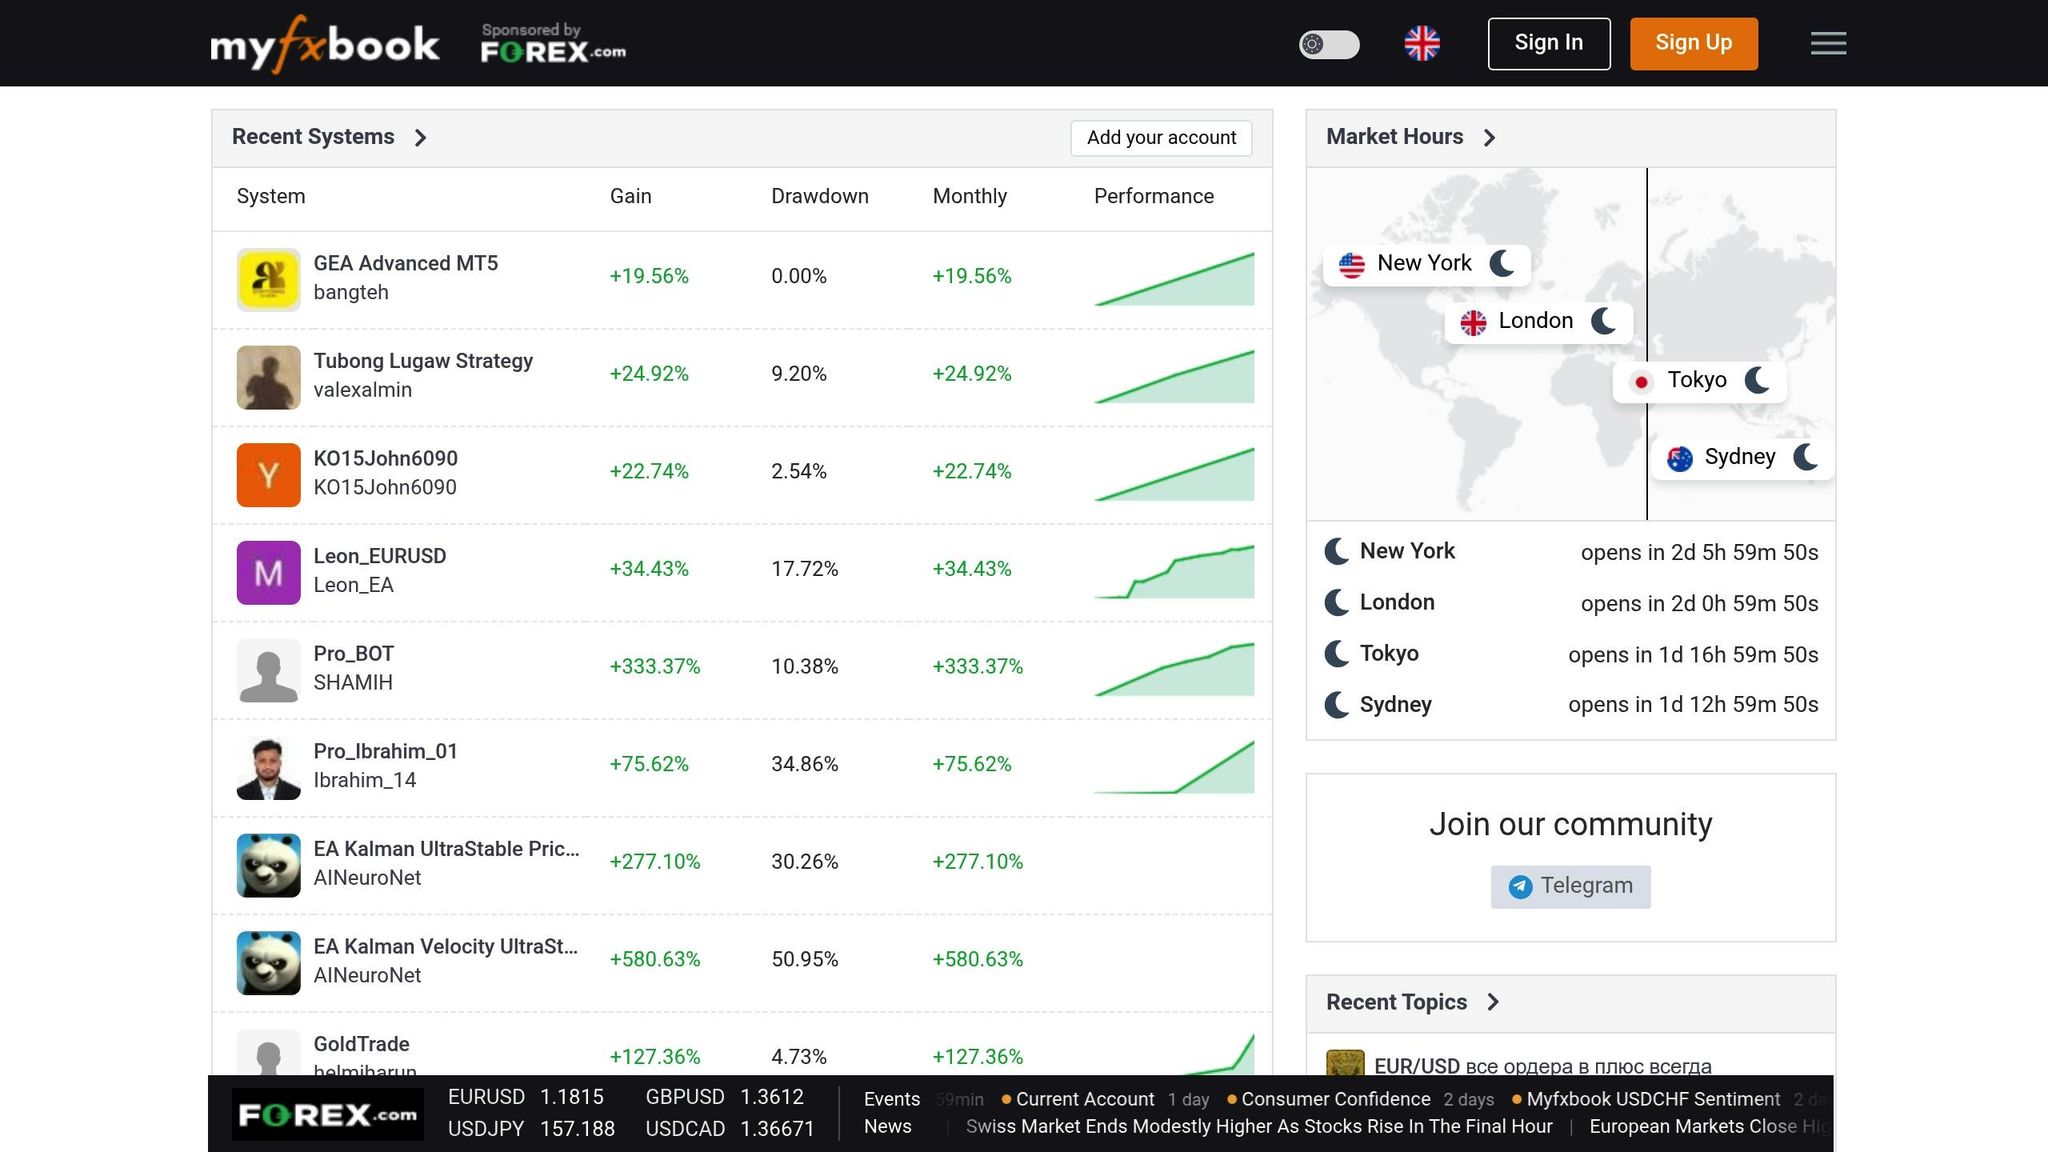
Public verification of your trading results adds a layer of credibility. By utilizing the account synchronization features, you can publish your challenge results on public leaderboards. This serves as verified proof of your trading skills. MyFXBook leaderboards, for example, highlight trading systems with gains exceeding +3,900% and drawdowns as low as 0.00%. Meanwhile, FX Blue allows you to publish simulation results and unlock its full suite of reporting and analysis tools.
Participating in For Traders tournaments or sharing your progress publicly can boost your reputation. Metrics like gain percentage, win rate, and monthly performance are key indicators of consistency and discipline. Building this credibility supports your ultimate goal of earning the 15% profit share offered by For Traders after passing the challenge.
| Tracking Feature | Why It Matters for Challenges | Action to Take |
|---|---|---|
| Real-Time Equity | Prevents drawdown violations | Check before each trading session |
| Best/Worst Trades | Identifies what's working | Focus on high-performing setups |
| Public Verification | Builds credibility and showcases progress | Share results on community platforms |
Conclusion
MyFXBook and FX Blue offer a game-changing way to approach simulated prop trading by giving you complete insight into your performance. Instead of relying on guesswork, these platforms provide real-time tracking of crucial metrics like balance, equity, and drawdown - key for staying within the 5% max drawdown limit according to the For Traders general rules. Their detailed analytics make it easy to spot which currency pairs or setups are working and which ones are dragging you down, allowing you to refine your strategy effectively.
What sets these tools apart are their advanced risk management features. FX Blue’s Smart Lines, for example, let you automate trend-line stop-losses and time-based exits, giving you more control than standard MetaTrader tools. The historical simulation feature is another standout, letting you practice with past market data at speeds up to 20 times faster than real-time, so you’re better prepared for the actual challenge environment.
If your goal is to hit the 9% profit target and secure the 15% profit share from For Traders, these tools are practically indispensable. Public verification features also add an extra layer of credibility, letting you showcase verified results on leaderboards - a huge advantage in tournaments or when building a reputation within the trading community.
To get started, make sure to enable the "Allow DLL imports" option, set up separate profiles for simulated and live data, and take advantage of the web publishing features to unlock the full range of analytics. With automated syncing, detailed reporting, and risk alerts, these platforms help you stay compliant with challenge rules while paving the way for consistent profitability as a funded trader.
FAQs
How can I use MyFXBook and FX Blue to improve my trading performance?
MyFXBook and FX Blue are excellent resources for traders looking to fine-tune their strategies. These platforms offer in-depth performance tracking and analytics, helping you pinpoint what’s working and what needs improvement. With features like trade analytics and equity tracking, you can keep a close eye on your progress and make informed adjustments to your trading methods.
Another standout feature is their support for simulated trading. Using historical data, you can test strategies in a risk-free setting, sharpening your timing and decision-making without the pressure of real money on the line. Regularly reviewing your performance and experimenting with new approaches can boost your confidence and help you aim for steadier, more reliable trading outcomes.
What are the most important metrics to track for success in prop trading?
To thrive in prop trading, it's crucial to monitor a few key metrics: profit and loss (P&L), drawdown, win/loss ratio, and consistency. Each of these offers valuable insights into your trading performance.
- P&L reflects your overall profitability, showing whether you're making or losing money over time.
- Drawdown measures the largest drop from a peak in your account balance, helping you gauge and control risk.
- Win/loss ratio highlights the quality of your trades by comparing successful trades to losses.
- Average trade duration can also be a useful indicator, shedding light on your trading style and patience.
For those engaged in simulated prop trading, these metrics are critical. They demonstrate your ability to achieve consistent profits while managing risk effectively - qualities that prop firms look for in traders. Balancing strong returns with controlled drawdowns is the hallmark of a successful trader. By regularly reviewing these metrics, you can fine-tune your strategies, enhance your performance, and boost your chances of sustained success.
How can I keep my account secure when using MyFXBook and FX Blue?
To keep your account safe while using MyFXBook and FX Blue, it's important to follow a few key security practices:
- Create strong, unique passwords for your trading accounts and never share them with anyone. If the platform supports two-factor authentication (2FA), make sure to enable it for an extra layer of security.
- Always connect your accounts using the secure, official methods provided by these platforms. Avoid sharing sensitive login information outside of their verification processes.
- Keep an eye on your account activity regularly to catch any unusual behavior early. Also, make it a habit to update your passwords from time to time.
Both platforms have verification systems in place to confirm account ownership and ensure trading data is accurate. For instance, MyFXBook might require specific verification steps, while FX Blue uses anti-tamper controls to maintain data integrity. By sticking to these practices, you can use their tools with confidence while keeping your account and trading data secure.
Related Blog Posts
Start Trading with For Traders
Join our platform to test your trading skills, trade virtual capital, and earn real profits. Access educational resources, advanced tools, and a supportive community to enhance your trading journey.
Start your Trading Challenge