


If you risk the same share count on every trade, your dollar risk can swing all over the place. I use volatility-based sizing to keep risk closer to fixed by making positions smaller when markets get jumpy and larger when markets calm down.
Here’s the short version:
- I start with a fixed account risk, often 1% to 2% per trade.
- I measure past movement with historical volatility or ATR.
- I turn that reading into a stop distance.
- Then I calculate position size with a simple rule: Position Size = Dollar Risk ÷ Risk per Unit.
- If volatility spikes, I cut size. If volatility drops, I can hold more shares or contracts.
- I also use a volatility floor so low-volatility periods don’t lead to oversized trades.
A few points matter most:
- Historical volatility uses past returns and is often annualized with √252.
- ATR is often easier for stop-based trading because it reflects daily range and gaps.
- Short lookbacks react faster; long lookbacks smooth noise.
- Inverse volatility works better for portfolios than for single-trade stop placement.
- Kelly-style sizing should act as a cap, not the main sizing rule.
- Backtesting and simulation matter because volatility can lag during market regime shifts.
Volatility Based Position Sizing For Capital Allocation? - Stock and Options Playbook
Quick Comparison
| Method | Best use | What it uses | When size gets smaller |
|---|---|---|---|
| ATR-based | Single trades with stops | Average True Range | When ATR goes up |
| Std. dev./HV-based | Rule-based sizing | Past return volatility | When HV goes up |
| Inverse volatility | Multi-position portfolios | Asset volatility weights | When asset volatility goes up |
| Kelly-inspired | Size ceiling based on edge | Win rate and payoff ratio to maintain a healthy risk-reward ratio | When volatility cap or edge says cut back |
In plain English: I’m not trying to predict the market with volatility. I’m using past movement data to stop one trade from risking $500 while the next one quietly risks $1,500 just because the chart moves more.
How Historical Volatility Fits Into Position Sizing
Historical volatility helps turn market movement into a clear per-trade risk amount. Then you divide your dollar risk by that amount to decide position size.
Position Size (Units) = Dollar Risk ÷ Risk per Unit
Here, Risk per Unit is the HV-based stop distance. Put simply, past price movement becomes a fixed risk budget for each trade.
How Historical Volatility Is Calculated
Calculating historical volatility (HV) is pretty straightforward:
- Gather historical price data for your chosen lookback window, such as 20, 60, or 252 trading days.
- Convert prices to daily returns, measure their standard deviation, then annualize with √252.
Annualized HV puts different assets on the same scale. That makes comparisons much easier. After that, you choose the lookback window and volatility proxy that fit the trade you’re taking.
How Volatility Affects Position Size
Volatility and position size move in opposite directions: when volatility goes up, position size needs to go down if you want to keep dollar risk the same.
Why? Because higher volatility usually means wider daily price swings. If your stop sits too tight, normal intraday noise can knock you out before the trade has a chance to play out. So when the stop distance gets wider, the number of units has to shrink to stay inside the same risk budget.
This kind of sizing also helps normalize risk across instruments. A low-volatility utility stock will need a larger position than a high-volatility biotech stock to hit the same 1% account risk. That means one sizing rule can work across very different markets.
It also helps to add a volatility floor, such as the 20th percentile of the past year’s readings, to avoid oversized positions during unusually quiet market periods.
Measuring Historical Volatility for Trade Planning
Standard Deviation, Lookback Windows, and Annualization
After you measure HV, the next call is how much history to use. That comes down to the lookback window. Shorter windows react faster. Longer windows smooth out noise. In practice, shorter windows tend to fit fast regime shifts, while longer windows tend to work better for steadier position sizing.
A simple way to think about it: the lookback period is a responsiveness dial. Turn it down with a short window, and your sizing can adjust fast after a volatility spike. The trade-off is that one wild day can throw things off. Turn it up with a long window, and your sizing gets more stable, but the model can leave you too large when the market changes in a hurry.
The math is sound, but for stop-based sizing, ATR often maps to the job more directly.
ATR as a Volatility Proxy for Sizing
Average True Range (ATR) ties straight to stop distance, which is why many traders use it as a practical stand-in for volatility. Standard deviation tracks price variation, but ATR measures the full daily range, including overnight gaps. That matters a lot when stops are part of the plan.
As a rule of thumb, use wider ATR multiples for swing trades and tighter multiples for day trades.
Data Quality, Outliers, and Regime Changes
Good inputs matter. But the bigger issue is that volatility can shift faster than your lookback window can catch up. Use adjusted, clean data so bad prints or messy data don’t skew position sizes. Outliers can also bend ATR and standard deviation, which can push sizing changes based on noise instead of actual market behavior.
Regime shifts are harder to spot and often more dangerous. Historical volatility always lags. So a calm stretch can make the rule increase size right before the market makes a sharp move.
One useful check is percentile ranking. Look at where today’s ATR sits inside its 252-day range. If the reading is high, cut size and give stops more room. If the reading is low, size can be larger and stops can be tighter. That gives you a cleaner sense of whether the model still fits current conditions and helps keep sizing steady instead of jumpy.
These inputs feed the sizing rules that come next.
Volatility-Based Position Sizing Frameworks
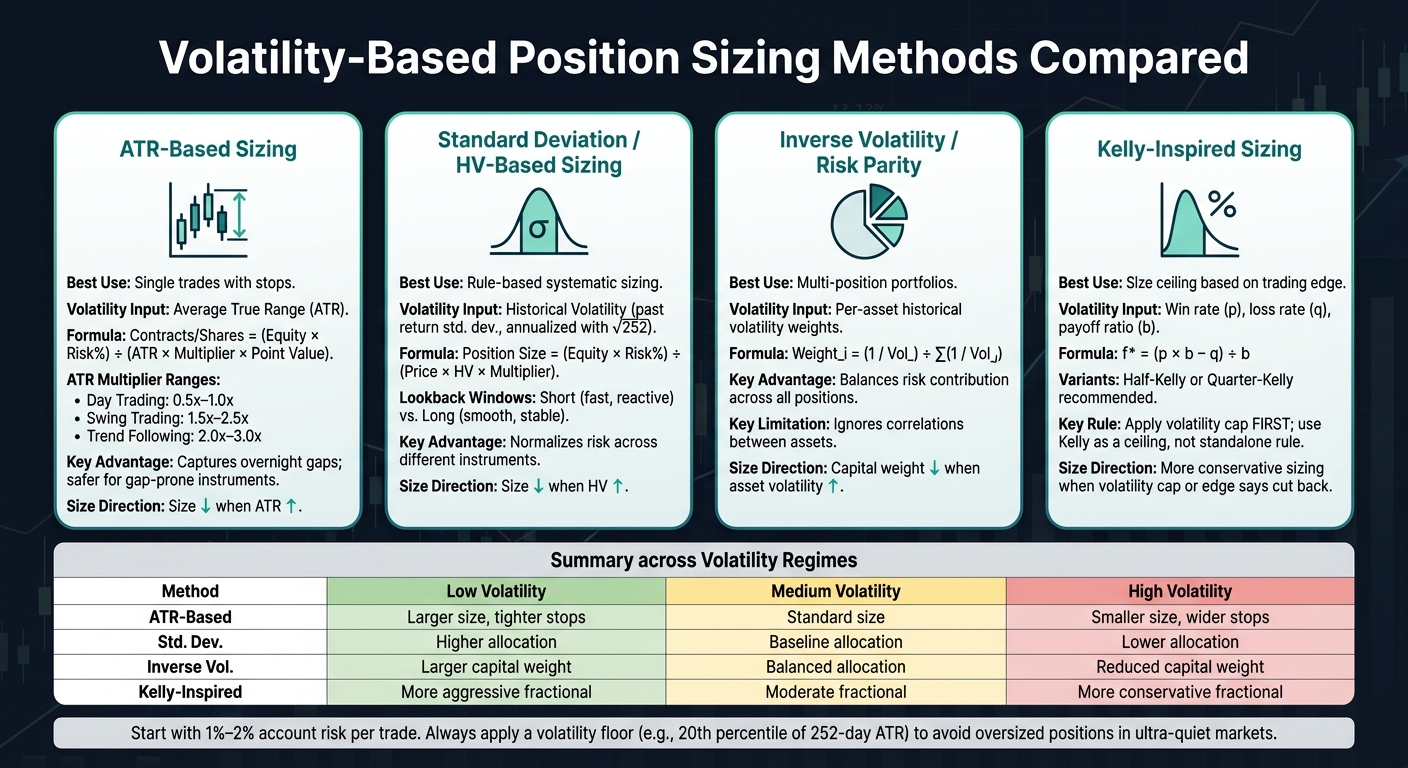
Volatility-Based Position Sizing Methods Compared
Once you’ve measured HV, the next step is simple: turn that reading into a sizing rule.
The rule you use should match the job. For single trades, stop-based methods make the most sense. For portfolios, allocation-based methods are usually a better fit. They solve different problems, so it helps to keep them separate.
ATR-Based and Standard Deviation-Based Sizing
ATR sizing turns account risk into shares or contracts by using stop distance and point value.
Formula:
Contracts/Shares = (Equity × Risk%) ÷ (ATR × Multiplier × Point Value)
Typical ATR multipliers run from 0.5x–1.0x for day trading, 1.5x–2.5x for swing trading, and 2.0x–3.0x for trend following.
Standard deviation-based sizing takes HV and converts it into per-trade unit risk. It’s often used in Van Tharp's Percent Volatility Model.
Formula:
Position Size = (Equity × Risk%) ÷ (Price × HV × Multiplier)
Here’s the practical difference: ATR tends to be safer for gap-prone instruments. If a market can jump overnight, ATR usually gives you a more grounded view of trade risk.
Inverse Volatility and Risk Parity Approaches
At the portfolio level, sizing shifts away from stop placement and toward risk balance. Inverse volatility weighting assigns weights based on measured historical volatility so each position adds roughly equal risk.
Formula:
Weight_i = (1 / Vol_i) ÷ Σ(1 / Vol_j)
This method is about balancing risk, not guessing which asset will perform best. That’s an important distinction.
The catch? It ignores correlations between assets. So if positions start moving together, diversification can weaken fast. On paper, the weights may look balanced. In practice, the portfolio can still lean harder than expected.
Kelly-Inspired Volatility Adjustments
Some traders size positions based on edge instead of stop distance. In that case, fractional Kelly can act as an upper limit.
The Kelly Criterion asks a direct question: given your edge, what fraction of capital gives the best long-term growth?
Formula:
f* = (p × b − q) ÷ b
Where p is win rate, q is loss rate (1 − p), and b is the payoff ratio (average win ÷ average loss).
Full Kelly can be extremely aggressive, so most traders use a fractional version like Half-Kelly or Quarter-Kelly. That tones down the aggression while keeping the edge-based logic in place.
One practical rule matters here: apply a volatility cap first. Kelly works best in this setup as a volatility-adjusted ceiling, not as a standalone sizing rule.
Applying Volatility-Based Sizing in Simulated Prop Trading
These sizing methods should be tested in simulation before live capital.
Building a Repeatable Risk Rule
Once you define the volatility rule, the next step is simple: turn it into something mechanical.
That means setting a fixed risk cap, measuring recent historical volatility, placing a volatility-adjusted stop, and then converting that stop distance into shares, lots, or contracts. A common starting point is risking about 1% to 2% of account equity.
One part many traders miss is the volatility floor. In plain English, that's a minimum ATR threshold, such as the 20th percentile of the past year's ATR readings, below which you stop increasing position size.
Why does that matter? Because ultra-quiet markets can trick you into sizing too big. On paper, the stop looks tight. In practice, a small move can still knock you out.
It's also smart to size below your hard limit. So if your max risk tolerance is 2%, size for 1.5% instead. That cushion helps absorb slippage in fast-moving markets without pushing you past your cap.
Once the rule is written down, test it against your past trades. See whether it would have kept you inside your drawdown limits during quiet, normal, and high-volatility periods. That kind of check often tells you more than theory does.
Using Volatility Rules in For Traders

That same rule can be tested inside For Traders with virtual capital and account-level drawdown limits. The platform's structure - a 5% max drawdown and a 9% profit target - gives you a clear risk range to work within.
If those guardrails keep clashing with your rule, that's a sign to adjust. Usually, that means cutting risk or widening the volatility multiplier.
Key Takeaways for Using Historical Volatility Data
The table below sums up how sizing tends to shift across volatility regimes.
| Sizing Method | Low Volatility | Medium Volatility | High Volatility |
|---|---|---|---|
| ATR-Based | Larger size; tighter stops | Standard size | Smaller size; wider stops |
| Standard Deviation | Higher allocation | Baseline allocation | Lower allocation |
| Inverse Volatility | Larger capital weight | Balanced allocation | Reduced capital weight |
| Kelly-Inspired | More aggressive fractional sizing | Moderate fractional sizing | More conservative fractional sizing |
Higher volatility calls for smaller size.
ATR and standard deviation are practical starting points for active traders. If you're managing a group of positions, inverse volatility or risk parity often does a better job of balancing exposure. Kelly-inspired adjustments tend to work best as a ceiling on size, not as a standalone rule.
FAQs
How do I choose between ATR and historical volatility?
You don’t need to treat them like competing metrics. ATR is a practical way to measure past volatility, and traders often use it for position sizing because it picks up overnight price gaps that standard deviation-based measures can miss.
Think of ATR as a responsiveness dial. Use 5–10 sessions for day trading and 14–20 sessions for swing or position trading.
What lookback period should I use for volatility-based sizing?
There’s no single “right” lookback period. Think of it as a responsiveness dial for your strategy.
A 14-day ATR is the go-to default for many swing and position traders. If you trade intraday, shorter settings like 5 to 10 periods often make more sense because they track current market conditions more closely. On the other hand, 20-period settings are common on institutional desks and in longer-term momentum strategies since they smooth things out and offer more stability.
Why use a volatility floor?
A volatility floor sets a minimum level for expected market movement. That way, your position size doesn’t get too large when volatility is unusually low.
In plain English: it puts a floor under your volatility estimate, so a calm market doesn’t trick you into taking on more risk than you should.
This helps keep risk within reasonable limits and protects your capital if volatility jumps after a quiet stretch.
Related Blog Posts
Start Trading with For Traders
Join our platform to test your trading skills, trade virtual capital, and earn real profits. Access educational resources, advanced tools, and a supportive community to enhance your trading journey.
Start your Trading Challenge