


A trading strategy is not ready just because a backtest looks good. I’d only trust it after I test slippage, spread jumps, delays, bad market phases, and losing-streak risk against challenge rules like daily loss caps and max drawdown.
Here’s the short version:
- I start with a fixed backtest with clear entry, stop, target, and position-size rules.
- I use at least 100 trades, but 300+ trades gives me more confidence.
- I test across 2 to 5 years of data, including trends, ranges, high-volatility periods, and market shocks.
- I track core numbers like max drawdown, profit factor, expectancy, win rate, and max consecutive losses.
- I then pressure the system with:
- 3x to 5x spreads
- 1 to 4+ ticks of slippage
- 1 to 3 seconds of delay
- 10% to 20% limit-order fill failure
- ±10% to ±25% input changes
- 30% to 50% cuts in average winner size
- 1,000+ Monte Carlo reshuffles
- I want stress-tested drawdown to stay well under the challenge cap, and I want expectancy to stay positive after trading costs and winner decay.
A few numbers matter more than the rest. If profit factor drops under 1.3, if drawdown swells to 1.5x to 2x the baseline, or if the worst simulated day breaks the daily loss rule, I treat that strategy as not ready.
| Check | What I look for |
|---|---|
| Baseline test | Fixed rules, no guessing |
| Sample size | 100 trades minimum, 300+ preferred |
| Data range | 3 to 5 years across different market conditions |
| Risk per trade | Usually 0.5% to 1.0% |
| Execution test | Slippage, spread jumps, delays, failed fills |
| Input test | Small setting changes should not wreck results |
| Path risk | 1,000+ Monte Carlo runs |
| Pass standard | Drawdown, daily loss, and expectancy stay in line |
My bottom line: if a strategy only works under clean backtest conditions, I would not use it in a trading challenge. I’d use one only after it shows it can survive bad fills, rough timing, and rule pressure.
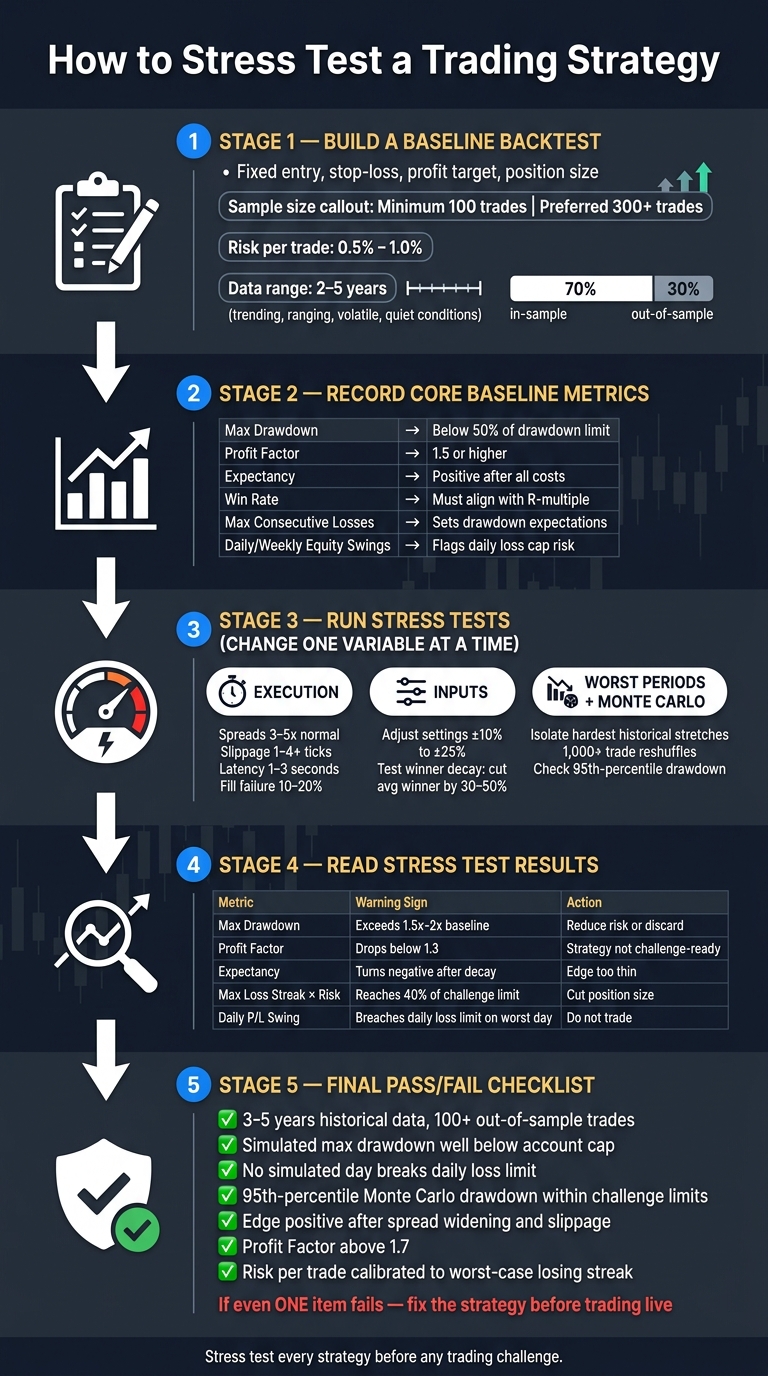
How to Stress Test a Trading Strategy: Step-by-Step Checklist
Monte Carlo Simulation: How to Stress-Test Your Forex Strategy
Build a Baseline Backtest First
A baseline backtest is your control test. It's a fixed, mechanical run of the strategy on past data, with the rules locked before you begin and no room for discretion. This is the version you'll pressure-test in the next step.
Write the rules out before you run anything. Be specific: define the entry trigger, stop-loss placement, profit target, and position size for every trade. For example: "Buy on the 15-minute high break; stop below the range low; target 2R; risk 1% per trade." If the rules are fuzzy, you can't repeat the test, and the result doesn't mean much.
Keep risk at 0.5% to 1% per trade so one bad streak doesn't put your daily loss limit at risk.
You also need enough trades for the sample to mean something. At least 100 trades is the floor. 100 to 300 is acceptable, and 300+ is better. If the strategy can't produce that many trades, the baseline is too thin to trust.
Use Historical Data Across Different Market Conditions
A baseline built on one friendly market regime can look great - until the market changes. Test the strategy across trending, ranging, high-volatility, and quiet conditions so weak spots show up early. A good target is 2 to 3 years of historical data, with 5 years viewed as ideal.
Make sure the sample includes major stress regimes, like crash selloffs and rate shocks. Those aren't rare one-offs. They're the exact kind of conditions a challenge account may have to sit through.
To cut down the risk of overfitting, use a 70/30 in-sample/out-of-sample split. Build and refine the strategy on the first 70% of the data. Then run it unchanged on the remaining 30%. If the results hold up out of sample, the edge has a better chance of being real. If performance falls apart, the strategy was fit to the past instead of built to handle what's next.
Record Your Core Baseline Metrics
After the backtest is done, record the key numbers before changing any inputs. These are your control metrics for every test that comes next.
| Metric | What It Tells You | Robustness Target |
|---|---|---|
| Max Drawdown | Largest peak-to-trough equity drop | Below 50% of the drawdown limit |
| Profit Factor | Gross profit ÷ gross loss | 1.5 or higher to absorb live decay |
| Win Rate | % of trades that close positive | Must align with your average R-multiple |
| Expectancy | Average dollar return per trade | Positive after all costs |
| Average Win / Average Loss | Size of typical winners vs. losers | Sets your edge buffer |
| Max Consecutive Losses | Longest losing streak in the test | Sets fair expectations for drawdown runs |
| Daily / Weekly Equity Swings | Intraday and intraweek volatility | Flags sessions that could breach daily loss caps |
A profit factor of 1.5 is a practical starting mark because live trading and market stress often chip away at backtest results by 15% to 25%. That buffer gives the strategy some room when results soften under live conditions. Use these numbers as the benchmark for the stress tests that follow.
How to Run Stress Tests Step by Step
Change one variable at a time, rerun the test, and compare each result against your baseline metrics. Those baseline numbers from the last section are your yardstick. They show how much each stress test shifts the strategy.
If a result drifts too far from the baseline, treat that as a warning sign. Dig into it before you use the strategy in a challenge, especially when max drawdown and daily loss limits are in play.
Change Execution Assumptions
Start here. Execution friction is usually the biggest gap between a backtest and live trading. On paper, backtests often assume cleaner fills than you'll get in the market.
To pressure-test execution, make these changes:
- Widen spreads to 3–5x their normal level to simulate a liquidity withdrawal.
- For ES and NQ futures, add 1–2 ticks of slippage per side in normal conditions and 2–4+ ticks during news events.
- Add 1–3 seconds of execution latency to simulate broker or platform delays.
- Model a 10% to 20% fill failure rate on limit orders during fast-moving markets.
This part matters more than many traders think. A system can look fine in a backtest, then fall apart once spreads widen and fills get messy.
If the strategy becomes unprofitable, or if drawdown climbs past 1.5x to 2x your baseline maximum after these changes, it’s probably leaning too hard on ideal fills for a challenge setting.
Change Strategy Inputs and Risk Per Trade
Once execution assumptions still look acceptable, shift to the strategy’s internal settings. Adjust indicator settings, entry thresholds, stop-loss distances, and other inputs by ±10% to ±25%.
You’re looking for a stable zone, not one magic number. Performance should stay in roughly the same range across nearby settings. If profits jump at one setting and collapse with small tweaks, that usually points to overfitting.
Keep risk at 0.5% to 1.0% per trade. Then test whether the strategy still works if average winners shrink by 30% to 50%. That’s a blunt but useful test. A strategy with decent bones should still show positive expectancy even when the average win gets cut down.
Test the Worst Historical Periods and Run Monte Carlo Tests
After parameter testing, go back and isolate the hardest stretches in your historical data. Run the strategy on those periods by themselves.
For example:
- A trend-following system should be tested in ranging markets.
- A mean-reversion system should be run through strong directional moves, like the post-COVID rally in 2020.
- Test the 30-minute window before and 60 minutes after major economic releases such as NFP and FOMC announcements.
Then run a Monte Carlo simulation. Reshuffle the order of your historical trades at least 1,000 times to create alternate equity paths.
This shows what could happen if your worst losing streak lands at the start of a challenge instead of the middle. That’s the kind of bad timing that can wreck an otherwise decent system.
If the 95th-percentile drawdown stays inside the challenge limit, the strategy has a better shot at making it through the evaluation.
These results lead straight into the next step: reading drawdown, win rate, and equity swings without getting thrown off by one good or bad run.
How to Read Stress Test Results Before You Trade
Use your baseline metrics as your reference point. The job here is simple: check whether stress changes would break the challenge. You don't need to obsess over every number. Focus on the few that decide whether the strategy can survive the rules.
Use the baseline metrics from the last section to decide whether each stress result is still safe enough to trade.
How to Read Drawdown in a Challenge Context
In a challenge, drawdown isn't just about how much the account drops. It's also about the path it takes - how deep the drop gets, how long you stay stuck there, and how fast the account recovers.
That matters because a strategy can look fine on paper and still fail inside the evaluation window. If a challenge lasts 30 days and your strategy has needed 45 days to recover from a deep drawdown in the past, it's not a good match for that setup. On top of that, many daily loss rules count intraday floating loss. So you can break the limit even when closed trades still seem okay.
A good safety buffer is to keep stress-tested drawdown below half of the challenge's total loss cap.
How to Read Win Rate Without Being Misled
A high win rate can fool people. It can make a weak strategy look stronger than it is.
So don't judge win rate on its own. Look at it next to expectancy, profit factor, and how much edge is left after winner decay.
When you review decay test results, pay attention to what they mean in plain terms: if the strategy becomes unprofitable after average winners shrink by 30% to 50%, the edge is too thin for a challenge. That's your sign to fix the strategy before starting an evaluation.
How to Read Equity Swings
Daily and weekly P/L swings show how steady the strategy is from one session to the next. A strategy often fails a challenge because short-term equity swings hit a rule limit, even when the long-term equity curve still looks fine.
Pay close attention to the longest losing streak in your Monte Carlo results. Then multiply that streak by your risk per trade. If that number reaches 40% of the challenge limit, cut your position size.
Use the table below to turn stress-test numbers into trading decisions.
| Metric | What It Means | What to Do |
|---|---|---|
| Max Drawdown | How far equity drops from peak under stress | Must stay under the account's drawdown rule; target below 50% of the total loss cap |
| Win Rate | Share of winning trades under adverse conditions | Lower win rates require stronger reward-to-risk to keep expectancy positive |
| Expectancy | Average return per trade after winner decay | Must stay positive; if it turns negative after decay, the edge is too thin |
| Profit Factor | Gross profit divided by gross loss under stress | Below 1.3 leaves little room for live execution drag |
| Max Loss Streak | Longest consecutive losing run across reshuffled paths | Streak × risk per trade must stay under 40% of the total limit |
| Daily P/L Swing | Intraday equity movement under spread widening | Must stay below the daily loss limit on the worst simulated days |
If any metric gets too close to the limit, cut risk before moving on.
Adjust Your Strategy and Decide If It Is Challenge-Ready
Turn Stress Test Results Into Risk Rules
Use the worst result from your stress tests to set your live trading limits.
Start with risk per trade. The formula is simple: daily loss limit ÷ worst-case intraday losing streak. That number becomes your hard cap per trade. In other words, your risk limit should come straight from what the tests showed, not from guesswork.
Next, set position size based on how many core stress tests the strategy passed. If it passed all of them, trade at full size. If it passed three out of five, cut position size to 50%–70% of your original plan. If it passed two or fewer, skip the strategy.
Set two more rules before you do anything live. First, do not trade 30 minutes before and 60 minutes after major news releases if your testing showed clustered losses in those periods. Second, spell out the no-trade regimes where the strategy is off-limits.
Final Checklist Before Using a Strategy in a Simulated Challenge
Once those rules are in place, run one last pass/fail check to make sure the strategy is still safe to use. If even one item fails, fix it before moving forward.
| Checkpoint | What to Verify |
|---|---|
| Historical Data | Tested on 3–5 years of data with 100+ out-of-sample trades |
| Max Drawdown | Simulated max drawdown stays well below the account's drawdown cap |
| Daily Loss Rule | No simulated day breaks the daily loss limit |
| Monte Carlo Robustness | 95th-percentile drawdown stays within challenge limits |
| Execution Friction | Edge stays positive after spread widening and realistic slippage |
| Profitability | Profit Factor above 1.7 |
| Risk Per Trade | Calibrated to the worst-case losing streak from stress tests |
If you're using a For Traders account, match each checkpoint to that account's specific rules. A strategy that only works in perfect conditions isn't ready for a challenge. One that still works when pressure hits has a much better shot.
FAQs
How do I know if my strategy is overfit?
An overfit strategy is tuned to past noise, not actual market behavior. It may look great in backtests, but that can be a trap.
A few red flags tend to show up early:
- An equity curve that looks almost too smooth
- Very high win rates
- Sharp performance spikes when you change parameters
Here’s a simple stress test: move your parameter settings by 10% to 25%. If net profit vanishes, the strategy is fragile.
You should also compare in-sample and out-of-sample results. If the Sharpe ratio or net profit drops by more than 50% on unseen data, the strategy is likely overfit.
What if my strategy has fewer than 100 trades?
Fewer than 100 trades usually isn’t enough to tell whether a strategy has an edge. With a small sample, your win rate and overall results can swing all over the place. At that point, you’re leaning more on hope than proof.
Aim for at least 100 out-of-sample trades before you trust the strategy in a challenge. If you’re not there yet, keep forward testing on a demo account until the sample is big enough to mean something.
How should I lower risk after a failed stress test?
If a strategy fails a stress test, cut risk right away. The goal is simple: protect capital and stay inside your drawdown limits.
The first move is usually the one that helps most: reduce position size per trade. Use your daily loss limit and the maximum number of consecutive intraday losses from the test to set a smaller, safer size.
It also helps to tighten your risk rules across the board:
- Cap losses per trade
- Cut size during high volatility
- Avoid high-impact news
- Adjust for overnight gaps
- Reduce exposure if slippage or wider spreads caused the failure
Think of it like taking your foot off the gas when the road gets slick. You’re not giving up on the strategy. You’re making sure one bad stretch doesn’t do too much damage.
Related Blog Posts
Start Trading with For Traders
Join our platform to test your trading skills, trade virtual capital, and earn real profits. Access educational resources, advanced tools, and a supportive community to enhance your trading journey.
Start your Trading Challenge