

If I’m testing rebalancing in a demo account, I’d start with one rule: use the same targets, the same cost assumptions, and compare every model against buy-and-hold. That’s the fastest way to see whether lower drift is worth more trades.
Here’s the short version:
- I set target weights first, such as 60/40 or a multi-asset mix.
- I pick a trigger rule next (often using TradingView scripts to automate the logic):
- Fixed schedule: weekly, monthly, quarterly, or annual
- Drift band: trade only after a threshold breach
- Volatility-aware: change band width when markets get rough
- I track the same numbers every time:
- CAGR
- max drawdown
- realized volatility
- turnover
- average drift
- rebalance count
- simulated cost drag
- I include trading friction in every test, such as:
- $5.00 to $25.00 per trade
- about 0.10% spread/slippage
- I keep a written demo plan with:
- target weights
- drift limits
- cooldown rules
- minimum trade size
- cash buffer
- stop rule for bad data or market halts
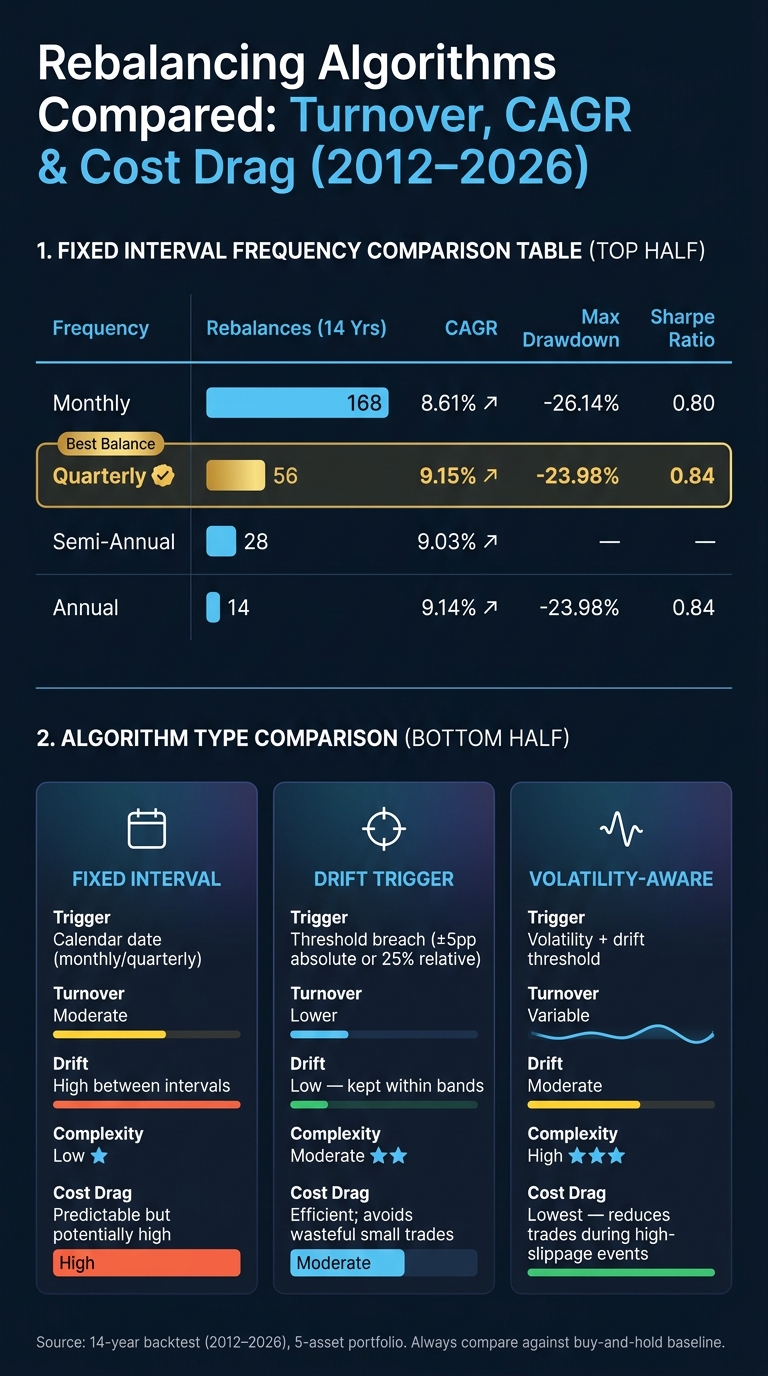
One result stands out from the article’s 2012–2026 example: quarterly rebalancing beat monthly rebalancing on both trade count and return in that test, with 56 rebalances and 9.15% CAGR versus 168 rebalances and 8.61% CAGR.
Portfolio Rebalancing Explained | Strategies, Timing, & Risk Management
Quick comparison
| Rule | What triggers trades | Main upside | Main downside |
|---|---|---|---|
| Fixed interval | Calendar date | Easy to test and compare | Can trade too often |
| Drift trigger | Band breach | Cuts small, wasteful trades | Needs band settings |
| Volatility-aware | Volatility + drift | Can lower cost drag in rough markets | Hardest to run |
My takeaway: start simple, log every trade the same way, and judge each rule by drift, turnover, and cost after friction - not just raw return.
Build the Base: Target Weights, Drift Rules, and Tracking Metrics
Choose Target Allocations That Match the Account's Risk Limits
Now turn those test goals into a target mix, a drift limit, and a simple scorecard.
Start with a target allocation that fits your risk limit. Without a target mix, rebalancing has nothing to anchor to. Common starting points include 60/40 for moderate risk and 80/20 for higher risk. If you're running a more layered demo portfolio, you might use a mix like 35% U.S. stocks, 20% international stocks, 20% gold, 15% bonds, and 10% REITs.
A core-satellite setup can also work well when you want one steady benchmark plus a smaller active sleeve. In that case, put 70%–80% in stable core positions and 20%–30% in active satellite strategies.
The target weights should line up with your drawdown limit. If that limit is tight, the mix should lean more conservative.
Set Drift Thresholds Before Testing Any Rule
After you set target weights, decide how far each position can move before you step in. That's your drift threshold. Set it before you test anything so your comparisons stay clean.
A common place to start is the 5/25 rule: rebalance when a position moves by more than 5 percentage points or more than 25% of its target weight, whichever comes first. This helps keep small positions from getting too large, while also stopping you from trading big positions over minor noise.
Use absolute bands for simple portfolios. Use relative bands when position sizes vary more.
The table below shows the lower and upper trigger points around each target weight.
| Target Weight | Lower trigger | Upper trigger |
|---|---|---|
| 10% | 8.16% | 12.20% |
| 30% | 25.53% | 34.88% |
| 50% | 44.44% | 55.56% |
| 70% | 65.12% | 74.47% |
(Source: Princeton Asset Symmetric Band Rebalancing)
Set the threshold before testing so you don't muddy the results.
Once the trigger is in place, compare it against a fixed monthly or quarterly schedule.
Key Numbers to Track When Testing Rebalancing Rules
To judge whether a rule works, track the numbers that matter. The point isn't just to see if a model made more money. You also want to know whether tighter drift control was worth the extra trading.
Focus on these metrics:
- Total return (CAGR): Compound annual growth rate across the test period. This is your baseline for model comparison.
- Max drawdown: The worst peak-to-trough drop. It shows whether rebalancing cut risk exposure.
- Realized volatility: Annualized standard deviation of returns. This tells you whether the portfolio stayed steadier over time.
- Turnover: The share of the portfolio traded each year. More turnover means more simulated costs.
- Average drift from target: The average gap between actual weights and target weights.
- Number of rebalance events: How often the algorithm acted. This helps when you compare fixed-interval rules with drift-trigger rules.
- Simulated cost drag: Total commissions and slippage. This shows whether tighter control paid off.
Always run a buy-and-hold control next to any rebalancing model. Without that baseline, it's hard to tell if the extra trading costs were worth the drop in risk.
Use For Traders' virtual capital accounts to log these metrics across test runs and compare models inside one simulated plan.
With targets, bands, and metrics in place, test a fixed-interval rule first.
Fixed Interval Rebalancing Algorithms for Demo Accounts
Rebalancing Algorithms Compared: Turnover, CAGR & Cost Drag (2012–2026)
Built on the target weights and drift limits above, a fixed interval algorithm rebalances on a set schedule - weekly, monthly, or quarterly - no matter what the market does. The calendar triggers the trade, not portfolio drift.
Monthly, Quarterly, and Weekly Rebalancing Rules Compared
Shorter intervals keep drift tighter, but they also lead to more trading. Longer intervals cut trading activity, but they let allocations wander more between resets.
In a 14-year backtest (2012–2026), Giacomo Melillo, Founder, Awalyt, tested a 5-asset portfolio that started with $10,000 across VTI, VXUS, GLD, BND, and VNQ. Monthly rebalancing led to 168 trades and finished at $31,750 (8.61% CAGR), while quarterly rebalancing needed just 56 trades and finished at $34,010 (9.15% CAGR). Melillo concluded that monthly rebalancing was the "clear loser" because it can cut winners before trend persistence plays out.
| Frequency | Rebalances (14 Years) | CAGR | Key Trade-Off |
|---|---|---|---|
| Monthly | 168 | 8.61% | Highest turnover; often cuts winners before trend persistence plays out |
| Quarterly | 56 | 9.15% | Balanced; enough events to compare models meaningfully |
| Semi-Annual | 28 | 9.03% | Low effort; catches meaningful structural drift |
| Annual | 14 | 9.14% | Lowest turnover; simplest to run |
For most demo portfolios, quarterly is a good starting point. You get enough rebalancing events to compare models in a useful way without piling up too many trades.
How a Fixed Interval Algorithm Works Step by Step
The logic stays the same no matter which schedule you pick. On each rebalancing date, move through this sequence:
- Get current prices for all holdings and calculate total portfolio value.
- Calculate current weights by dividing each asset’s value by total portfolio value.
- Find the target dollar value for each position: Target % × Total Portfolio Value.
- Calculate the trade amount for each asset: Target Value − Current Value. A positive number means buy; a negative number means sell.
- Convert to shares by dividing the trade amount by the current price. Round to whole shares when needed and log leftover cash.
- Record the trade and estimated cost in your rebalancing log.
That last step still matters, even in commission-free demo accounts. Log a theoretical bid-ask spread and slippage in U.S. dollars so your results reflect realistic trading friction.
Here’s a simple example. If your total portfolio is $116,200 and your target stock allocation is 60%, then the target dollar value for stocks is $69,720. If stocks are currently worth $75,000, you would sell $5,280 worth and record that trade along with its estimated slippage cost in U.S. dollars.
When Fixed Interval Rules Work Best in Demo Testing
Fixed interval models work best when you want a clean baseline. Since the rule never changes and only the calendar sets off the rebalance, you can measure exactly how much drift built up between resets and how much it cost to fix. That makes this setup a solid benchmark for testing whether drift-trigger rules can cut turnover without letting allocations move too far.
Drift-Trigger and Volatility-Aware Rebalancing Rules
Drift-trigger and volatility-aware rules only trade when your portfolio moves far enough away from its target. That’s the big idea. If you want fewer pointless trades, drift-based triggers usually make more sense than rebalancing on a fixed calendar. In a demo account, the goal is simple: compare each rule by turnover, drift, and cost drag.
Tolerance Bands That Trigger Rebalancing Only When Needed
A tolerance band puts a drift range around each target weight. If an asset stays inside that range, you do nothing. A rebalance happens only when the weight moves past the limit.
For example, if your target stock allocation is 60% with a ±5% absolute band, you don’t rebalance until stocks fall below 55% or rise above 65%.
The trade-off is pretty straightforward. Wider bands lead to fewer trades, but they let drift build up. Narrower bands keep the portfolio closer to target, but they increase turnover. In a 60/40 portfolio, a 5-percentage-point band is viewed as aggressive, while a 10-point band is more moderate and more cost-effective for most DIY investors.
Absolute Bands vs. Relative Bands
These two band types act differently, especially when position sizes vary.
An absolute band uses the same percentage-point threshold no matter the target weight. A relative band scales with the target weight. So if you use a 25% relative band on a 40% target, the trigger points are 30% and 50%.
Absolute bands can break down with small positions because they don’t account for position size. Relative bands do a better job there because the threshold moves with the size of the holding.
A practical hybrid is the 5/25 rule. Use it here as a quick decision shortcut, without going back through the full mechanics.
Volatility-Aware Rules for Adjusting Rebalancing Speed
A volatility-aware rule changes band width based on current market conditions. When volatility is high, you tighten the bands to keep risk from drifting too far. When markets are calmer, you widen them so you’re not trading for no good reason.
During extreme market shocks, widening thresholds by 1 to 3 percentage points can cut down on overtrading and help you wait until spreads settle down.
It also helps to add a 5- to 10-day cooldown after each rebalance. Then pick either a full reset or a band-boundary reset to manage turnover. Resetting to target clears out leftover drift. Stopping at the band edge cuts turnover.
The table below compares the three rule types across turnover, drift, and complexity.
Comparison Table: Fixed Interval vs. Drift Trigger vs. Volatility-Aware Rules
Use this table to pick the simplest rule that stays within your drift and cost limits.
| Algorithm | Trigger Type | Turnover | Drift | Complexity | Cost Drag |
|---|---|---|---|---|---|
| Fixed Interval | Calendar (monthly/quarterly) | Moderate | High between intervals | Low | Predictable but potentially high if trading during spikes |
| Drift Trigger | Threshold breach (absolute or relative) | Lower | Low; kept within bands | Moderate | Efficient; avoids wasteful small trades |
| Volatility-Aware | Volatility + threshold | Variable | Moderate | High | Lowest; reduces trades during high-slippage or shock events |
Once you pick a rule, log every rebalance and compare drift, turnover, and cost drag.
How to Track Results and Write Rebalancing Rules Into a Simulated Trading Plan
Build a Rebalancing Log and Performance Review Process
Once you pick a rule, track every rebalance the exact same way. Log every rebalance event. If you don't, you can't tell whether the rule is doing its job.
For each rebalance, record the date and timestamp, the algorithm type, drift by asset before rebalancing, every trade made, simulated commissions, spreads, and slippage, plus the post-rebalance weights. Your log should also show whether the bands you chose actually kept weights inside the limits you set earlier. That connects each entry back to the drift thresholds in your plan.
Track these core metrics: total return, CAGR, maximum drawdown, realized volatility, turnover, average drift from target, and simulated cost drag. Also note the number of threshold breaches and how long the portfolio spent in shock mode or high-volatility mode.
Here's one detail people often miss: use asset prices from the same date across the whole log. If you mix fresh prices with stale ones, you can create fake drift readings of 1 to 2 percentage points. That can throw off the whole comparison.
Don't judge a rule from one rebalance. Look at it across many events.
Write a Demo Plan to Keep Rebalancing Rules Consistent
Use the log to turn your test into written rules. Put the rules on paper before the market moves.
Your plan should spell out target weights, the rebalance trigger, drift thresholds, cooldown periods, minimum trade sizes, and your cash buffer policy. The trigger can be a calendar date, a drift threshold, or both. You should also define your skip rule: the minimum drift size that makes a trade worth doing.
Add a kill switch too. This is the rule that pauses the algorithm if there's a data feed gap or an extraordinary market halt.
How to Compare One Rebalancing Model Against Another
Compare models using the same inputs. Run each one over the same date range, starting balance, target weights, and cost assumptions. If one model assumes optimistic mid-price fills and another assumes adverse fills, you're not making a fair comparison.
Using the same setup helps you isolate the effect of the rebalance rule itself. For a side-by-side review, focus on drift control, turnover, and net cost-adjusted return. The table below shows how those metrics played out in a 14-year backtest (2012–2026) across different rebalancing frequencies:
| Metric | Monthly | Quarterly | Annual |
|---|---|---|---|
| Rebalance Events | 168 | 56 | 14 |
| CAGR | 8.61% | 9.15% | 9.14% |
| Max Drawdown | -26.14% | -23.98% | -23.98% |
| Sharpe Ratio | 0.80 | 0.84 | 0.84 |
Test your models during rough periods too, not just calm stretches of market history. A rule can look neat in a smooth backtest and then act very differently when markets get hit hard.
Conclusion: Start Simple, Measure Drift, and Compare Results Over Time
The process matters more than any one outcome. Define your target allocations, test one algorithm at a time, and log every rebalance event the same way. Then compare fixed-interval, drift-trigger, and volatility-aware models over the same review period with the same cost assumptions.
A good rebalancing process is rules-based, measurable, and repeatable. If you can't explain exactly when your algorithm trades, how much it trades, and why, the plan still needs work.
FAQs
Which rebalancing rule should I test first in a demo account?
A threshold-based rebalancing rule is a solid place to start. Instead of trading on a set calendar, it rebalances only when an asset’s weight moves far enough from your target, such as a 5% absolute deviation.
That approach can help keep risk in check without trading more than you need to. It also helps cut turnover and transaction costs. In a simulated trading plan, you can watch how it reacts to bigger market moves while ignoring small day-to-day noise.
How wide should my drift bands be?
Set drift bands by weighing risk control against transaction costs. A 5-percentage-point threshold is common, but it can be a poor fit for smaller positions.
A lot of traders use the 5/25 rule: rebalance when a holding moves more than 5 percentage points from its target weight, or more than 25% of that target weight, whichever is smaller. In general, higher volatility and higher trading costs point to wider bands.
What trading costs should I simulate when backtesting rebalancing?
Simulate transaction costs so you don't overstate performance, especially when rebalancing triggers frequent trades.
That means factoring in broker commissions or per-trade fees, bid-ask spreads, and, in taxable accounts, possible tax drag. Build those costs into your execution rules so your backtest does a better job of matching what would happen with actual money.
Related Blog Posts
Start Trading with For Traders
Join our platform to test your trading skills, trade virtual capital, and earn real profits. Access educational resources, advanced tools, and a supportive community to enhance your trading journey.
Start your Trading Challenge