
Managing a funded trading account is challenging. You need to hit profit targets while staying within strict rules like drawdowns and daily loss limits. On top of that, hidden costs like evaluation fees and resets can eat into your profits. The solution? Use tools that track performance, ensure compliance, and provide insights to improve your trading.
Here are 7 tools that can help you stay on top of your game:
- For Traders Dashboard: Centralizes data from multiple prop firms and tracks real-time metrics like drawdowns and daily P&L.
- TradeZella: Syncs with brokers, tracks mistakes, and offers features like "Evaluation Mode" to monitor funding phases.
- Tradervue: Provides in-depth analytics, trade journaling, and time-based performance breakdowns.
- TradesViz: Tracks over 600 metrics, integrates with 40+ brokers, and uses AI-powered analytics for insights.
- PropTrackerHQ: Focuses on managing costs and net profits, with tools for ROI analysis and tax prep.
- TradingView: Offers charting, strategy testing, and paper trading to refine strategies and track performance.
- Custom Spreadsheet Journal: Fully customizable for tracking trades and compliance, but requires manual effort.
Each tool caters to specific needs - whether it's automation, analytics, cost tracking, or customization. Choose based on your priorities, like rule compliance, cost management, or strategy refinement. Free trials and budget-friendly options are available, making it easy to find the right fit for your trading style.

Comparison of 7 Trading Performance Tracking Tools for Funded Accounts
1. For Traders Dashboard
Performance Tracking Features
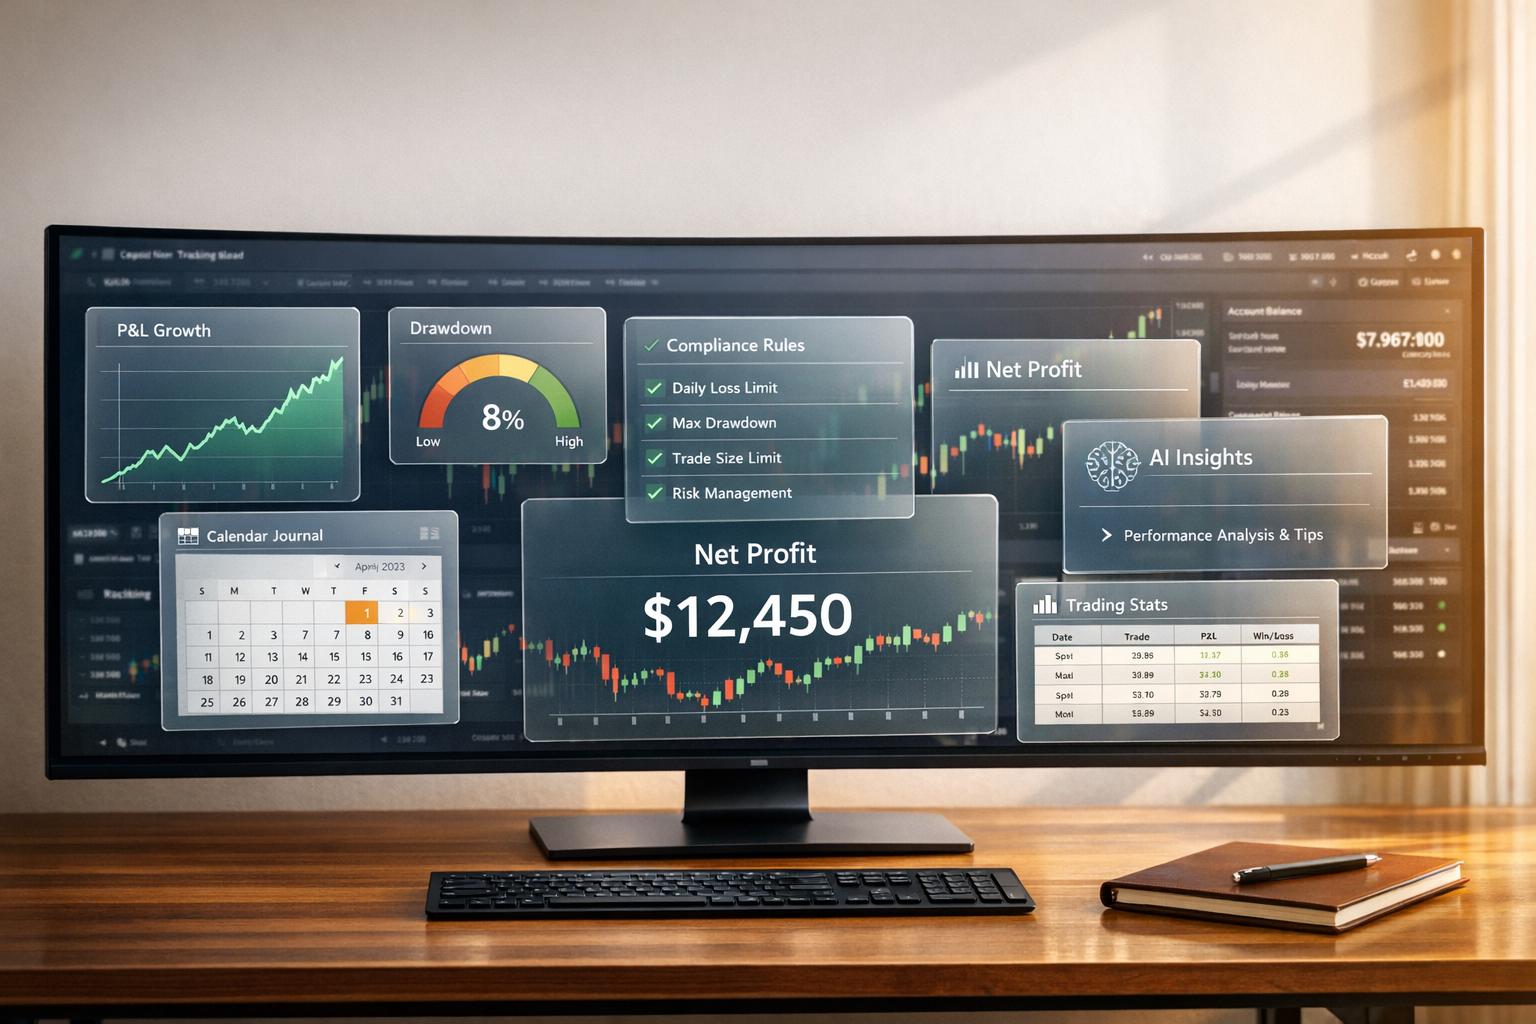
The For Traders Dashboard brings all your funded account data into one convenient view, eliminating the need to log into multiple platforms. With real-time profit and loss tracking, it displays critical metrics like daily P&L, total account balance, and real-time equity curves. This makes it easy to gauge your performance at a glance and ensure you're staying within your trading limits - essential for effective risk management.
What’s more, the dashboard integrates data from multiple prop firms, such as Apex, Topstep, and FTMO, into a single interface. This means you can monitor all your positions, balances, and performance metrics without hopping between different platforms.
Integration with Prop Firm Rules
The dashboard doesn’t just track performance - it also keeps you compliant. It automatically monitors key rules like daily loss limits, trailing drawdowns, and static drawdowns. By providing real-time alerts as you approach these thresholds, it helps you avoid costly mistakes. This gives you the chance to adjust your position sizes or step away from trading before breaching any rules.
Analytics and Insights for Traders
Going beyond simple tracking, the dashboard delivers insights that help you fine-tune your trading strategy. It analyzes and visualizes metrics like trade duration, frequency, win rate, and drawdown, helping you spot patterns such as overtrading or inconsistency in your approach.
Risk analytics also play a key role, offering visual representations of drawdown trends. These insights can be invaluable when you're aiming to scale your account or demonstrate consistent profitability to your prop firm. By identifying areas for improvement, the dashboard helps you sharpen your skills and build a more disciplined trading approach.
How To Pass A Funded Account In 2026
2. TradeZella
TradeZella focuses on simplifying performance tracking and improving error analysis through automation.
Performance Tracking Features
TradeZella removes the hassle of manual data entry by syncing directly with major brokers. It integrates seamlessly with platforms like MetaTrader 4, MetaTrader 5, NinjaTrader, Tradovate, and Rithmic - key tools for most prop firm traders. This automation can save traders up to 70% of the time they would otherwise spend entering data manually.
Once connected, TradeZella provides detailed tracking of metrics such as profit and loss, win rate, profit factor, expectancy, equity curves, and risk-to-reward ratios. With over 50,000 active users and more than 20.5 billion trades logged, the platform has demonstrated its reliability and scalability.
One standout feature is its mistake tracking system, which quantifies the cost of trading errors in dollar terms. Interestingly, TradeZella's data shows that 82% of traders repeat the same mistakes without realizing it until they see the financial impact. Additionally, the platform allows users to tag trades based on emotions like FOMO or revenge trading. These tags can then be analyzed against actual profit and loss outcomes, offering insights into how emotions influence performance.
TradeZella also helps traders adhere to prop firm rules.
Integration with Prop Firm Rules
The platform includes a specialized "Evaluation Mode", designed to monitor progress through various funding phases. It tracks key milestones like profit target achievements and reset histories. A rule checklist dashboard automatically flags violations of essential prop firm requirements, such as daily loss limits, restrictions on news trading, and session timing rules.
Another helpful tool is the "Finish My Day" feature, which acts as a safeguard against overtrading and revenge trading - two common pitfalls that can drain funded accounts. Once activated, this feature locks your session, provides a performance summary, and prevents additional trading for the day. It’s particularly useful when you’ve either hit your daily target or reached a loss limit.
Analytics and Insights for Traders
TradeZella goes beyond basic tracking by offering 50+ data-driven reports to help traders pinpoint what’s working and what’s not. The Strategy Playbooks feature enables users to create and evaluate specific trading setups, providing statistical expectancy for each. If a playbook consistently shows negative expectancy over a significant number of trades, it’s a clear signal to stop using that strategy.
Additional tools like the Trade Replay feature and drawdown widgets allow traders to review executions in detail and monitor both maximum and average drawdowns. These insights help determine whether a losing streak is part of normal variance or an indication of a deeper strategy issue.
"TradeZella turns every execution into data, every session into insights, and every mistake into a lesson you'll actually learn from." - TradeZella
3. Tradervue
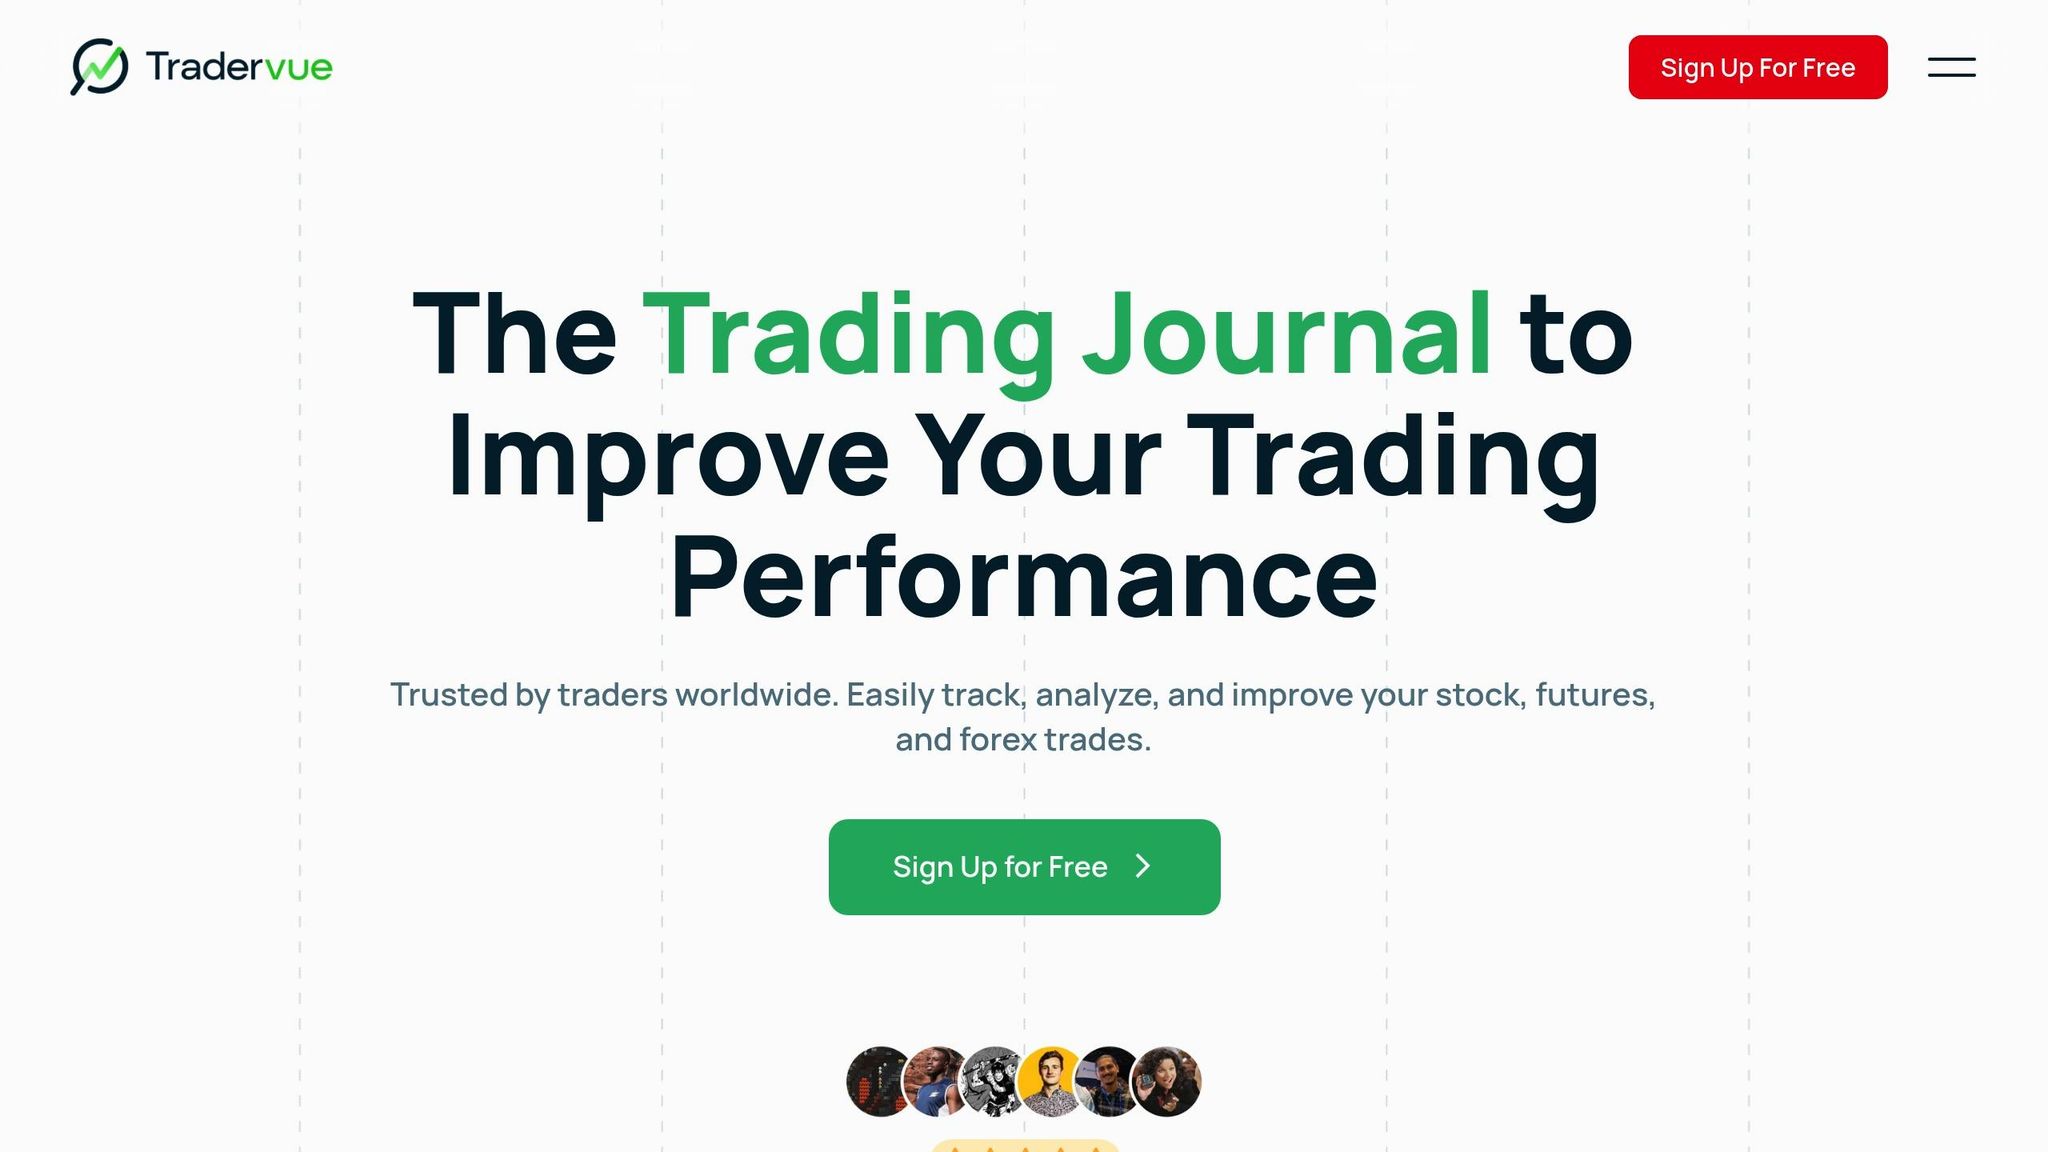
Tradervue provides in-depth analytics and integrates with over 80 platforms, catering to more than 207,623 traders. It automatically imports trades and creates price charts across multiple timeframes, from weekly down to 1-minute intervals, highlighting your buy and sell points for easy review.
Performance Tracking Features
Tradervue focuses on tracking the metrics that matter most to funded traders: daily and cumulative P&L, win percentage, trading volume, and intraday running P&L. It supports a wide range of instruments, including stocks, options, futures, and forex, all within a single interface. Futures traders can even generate reports based on either USD returns or ticks, offering flexibility in performance analysis.
One standout feature is the Daily Running P/L Graph, which visualizes intraday equity swings to help traders stay aware of their drawdown limits. As Scot1and, a verified user, shared:
"Tradervue will show you the max amount you were down in a trade and the max amount you were up in the trade. I love seeing stuff like this".
With these tools, Tradervue provides a solid foundation for evaluating and improving trading strategies.
Analytics and Insights for Traders
Tradervue goes beyond basic tracking by offering advanced analytics that refine exit strategies and risk management. The Exit Performance tool, for example, compares your actual exit P&L with the best possible exit you could have achieved. This feature is particularly helpful for identifying if you're cutting winning trades too early, a common challenge for traders managing funded accounts.
Time-based analytics break down performance by hour and day of the week, helping traders pinpoint their most and least profitable periods. This can reveal patterns like "boredom trading" during low-volume times. SDhillon07, another verified user, explained:
"This tells me I lose the most money from lunch hour till PH. Why? Because around this time frame this is when the volume is at its lowest and this is where most people (including me) boredom trade".
The platform also tracks Maximum Adverse Excursion (MAE) and Maximum Favorable Excursion (MFE), showing how far trades moved against or in your favor. These insights are essential for maintaining risk within the limits set by proprietary trading firms.
Customization Options for Funded Accounts
Tradervue offers extensive customization options, making it especially useful for traders working with funded accounts. The tagging system allows you to label trades by setups, strategies, or even the specific evaluation program you're trading under. Tag Reports enable you to compare performance across different strategies - such as breakout trades versus support plays - helping you determine what works best within the constraints of your account.
Mike Bellafiore, Co-founder of SMB Capital, highlighted the platform's value:
"SMB traders rely on Tradervue for journaling and performance analysis".
ProLeagueTrading, a verified user, also shared their experience:
"I've been using Tradervue for several years now and it has been an incredible tool that has helped me get funded at several prop firms. It's given me much more confidence to stick to my plan and process even when suffering through the inevitable drawdowns in trading".
Tradervue offers a free basic journaling plan, while its Gold Plan unlocks advanced features like exit analysis, risk reporting, and detailed templates for deeper performance reviews.
4. TradesViz
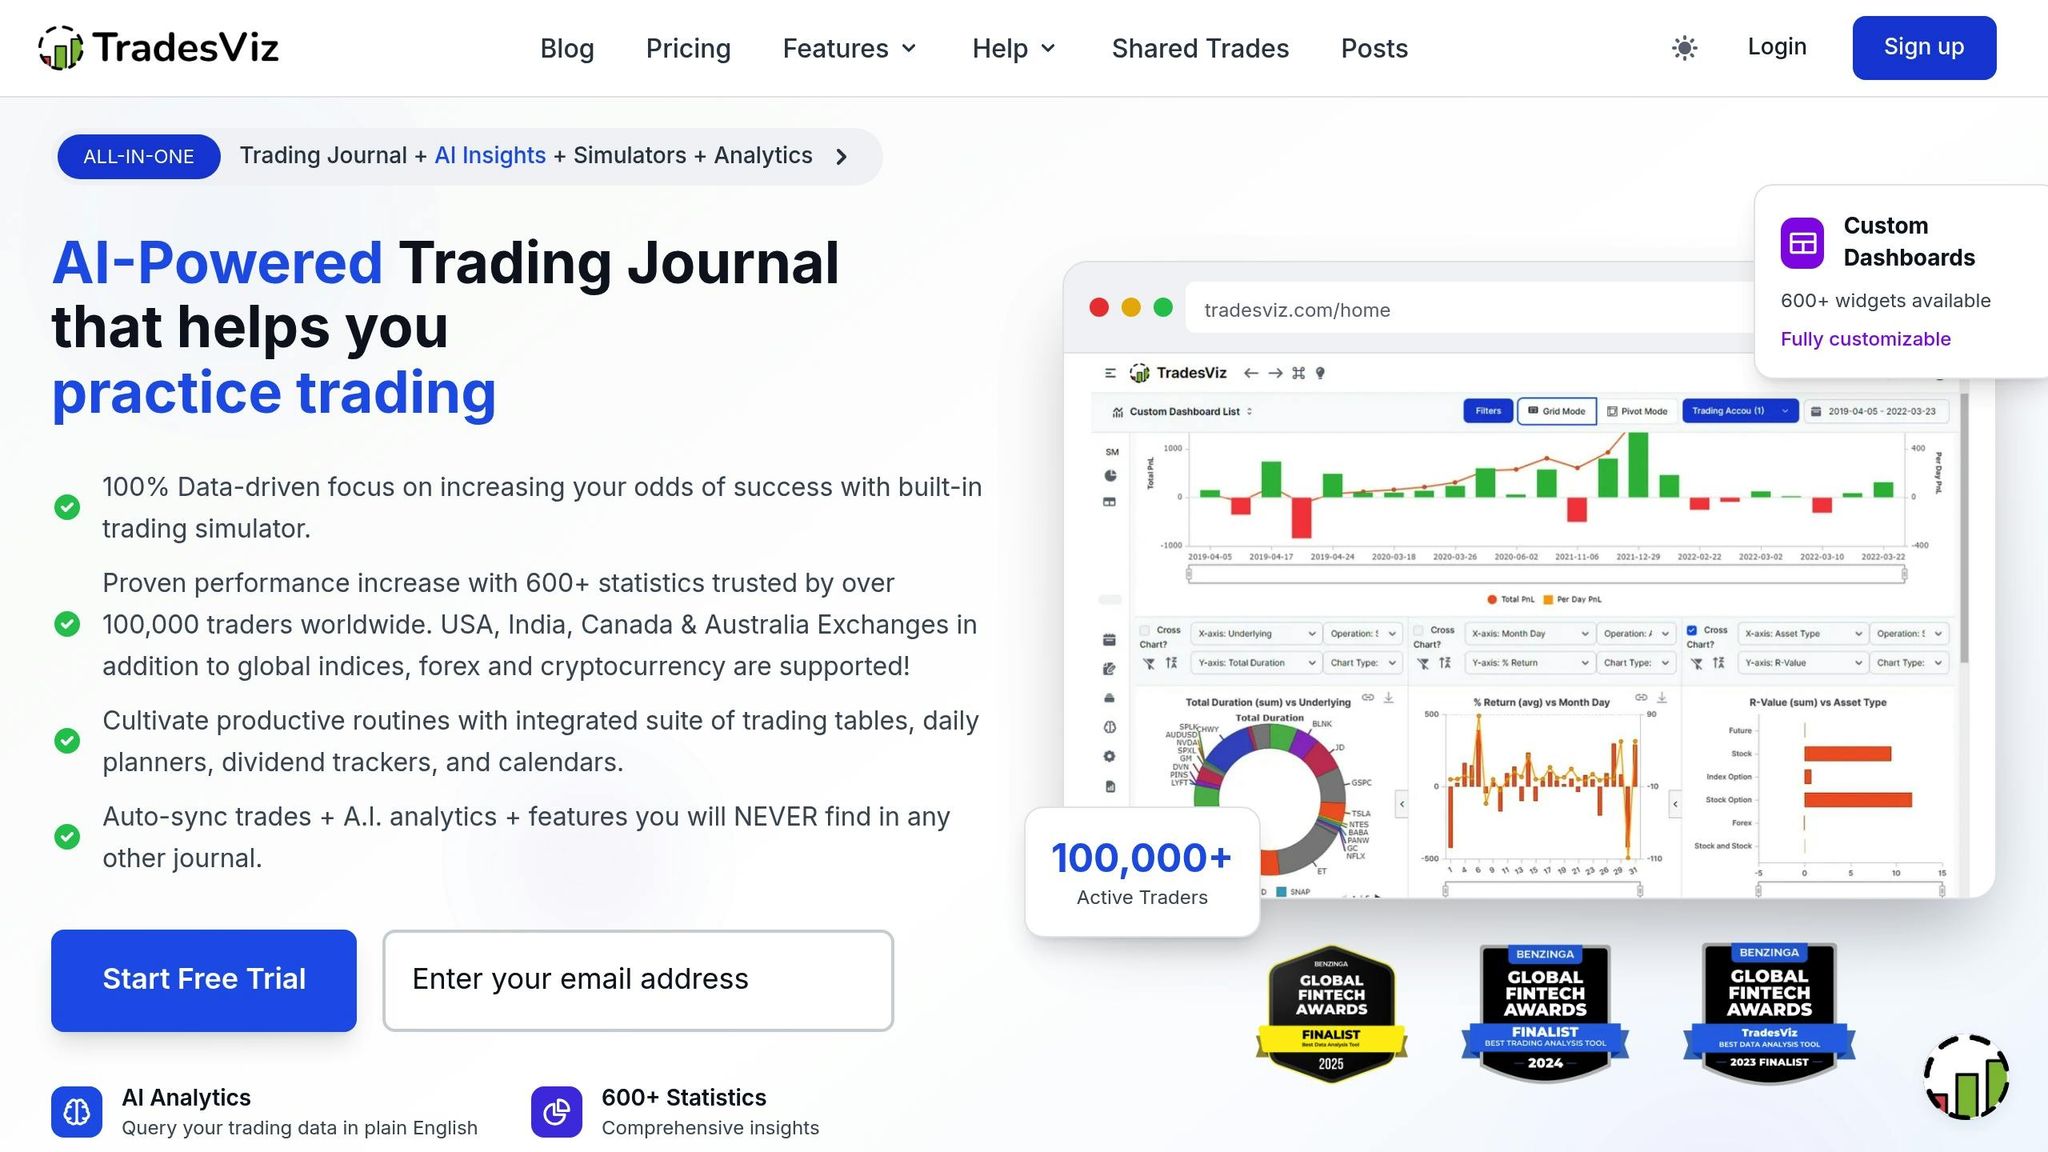
TradesViz combines advanced tracking and analytics to help traders manage their funded accounts effectively. It consolidates data from multiple prop firm accounts and brokers into a single, user-friendly dashboard. With support for over 40 brokers and the ability to manually import data from more than 300 platforms - including Tradovate, NinjaTrader, Rithmic, and Sierra Chart - TradesViz makes it easy to monitor both evaluation and funded accounts for firms like Apex and Topstep.
Performance Tracking Features
TradesViz offers detailed performance tracking with over 600 metrics, such as win rate, expectancy, R-multiples, and SQN. For traders managing funded accounts, its real-time monitoring of trailing and daily drawdown limits is invaluable for staying within prop firm guidelines. The platform’s interactive PnL calendar highlights daily performance and overlays key economic events, helping traders identify patterns and adjust their strategies [30, 36]. Additionally, the equity curve visualization provides a clear view of progress toward profit targets, making it easier to track milestones for payouts and evaluations.
Integration with Prop Firm Rules
The platform is designed to align with the unique requirements of prop firms. Traders can create custom dashboards tailored to different evaluation stages, tracking metrics like consistency percentages and drawdown thresholds. Goal-setting tools allow users to establish profit targets and risk limits, with visual alerts to ensure compliance. By auto-syncing data, TradesViz reduces manual entry by as much as 40%, saving time and minimizing errors. This real-time tracking helps traders avoid violations that could jeopardize their accounts.
Analytics and Insights for Traders
TradesViz leverages AI-powered analytics to deliver instant insights. For example, traders can analyze questions like "Why do I lose money on Fridays?" and receive actionable feedback. The platform has processed over 50 million trades for more than 100,000 active users worldwide. Features like dispersion charts help traders evaluate stop-loss tightness and exit timing, while exit efficiency analysis compares actual exits to theoretical best-case scenarios.
Professional traders have praised TradesViz for its robust capabilities. Gregory, a futures day trader, shared:
"In terms of raw analytics, comparison, and filtering capabilities, there is no match for TradesViz."
Steve Burns, founder of NewTraderU.com, also highlighted its benefits:
"TradesViz is the most useful trading journal on the market for finding and quantifying your edge. An all-in-one trading journal tool for traders."
Customization Options for Funded Accounts
TradesViz stands out for its customization options, offering drag-and-drop dashboards with over 600 widgets. Traders can create separate dashboards for evaluation and funded account stages, ensuring alignment with specific rules and metrics. The tagging system allows users to categorize trades by setup type and manually tag mistakes to evaluate their financial impact. Custom checklists enable traders to track qualitative factors like psychological state and adherence to trading rules. For deeper analysis, the Pivot Grid feature aggregates 90 data points per trade in a spreadsheet-style format.
TradesViz offers a free basic plan that supports up to 3,000 executions per month. The Pro plan, priced at $19.99 per month (or $179 annually), includes unlimited imports and AI-powered features. For $29.99 per month (or $269 annually), the Platinum plan adds advanced tools like custom dashboards, trading simulators, and exit analysis.
5. PropTrackerHQ
PropTrackerHQ approaches prop trading with a business mindset, focusing on managing the financial aspects of multiple funded accounts. The tool highlights net profit after deducting expenses, giving traders a clearer picture of their actual earnings. This is particularly helpful for those navigating evaluations across several prop firms. By emphasizing overall financial health, it complements other tools that focus solely on trade execution.
Performance Tracking Features
The Live Command Center provides a comprehensive overview, displaying total payouts, overall expenses, net profit, and pass rates. What sets PropTrackerHQ apart is its ability to track fees and integrate them into a broader business view. It monitors evaluation-related costs like platform fees, data feeds, and community subscriptions, while also sending reminders for upcoming payments. Additionally, it simplifies tax preparation by generating PDF reports that summarize payouts, expenses, and transaction logs.
This isn't just about numbers - PropTrackerHQ goes deeper by offering insights into profitability and financial management.
Analytics and Insights for Traders
Beyond tracking performance, PropTrackerHQ delivers advanced financial analytics. The ROI Analysis page uses charts to compare total payouts against costs for each firm, specifically focusing on prop evaluations. This visual breakdown helps traders identify where fees and reset costs might be eating into their profits. For example, David B., a trader managing evaluations with three firms, shared:
"I'm juggling evaluations with three different firms, and this tool is the only way I can keep it all straight. Seeing the cost-vs-payout chart on the analysis page was a real eye-opener for me."
While other tools emphasize trade execution and compliance, PropTrackerHQ shifts the focus to cost management and net profitability. Using AI-driven insights, it analyzes data like expenses, payouts, and pass rates to offer personalized coaching based on patterns it detects. The Backtest Logger adds another layer of value, allowing traders to backtest strategies with features like R-multiple tracking and equity curve visualization - all without risking real money. Maria K., a trader funded by three firms, remarked:
"Finally, a tool that understands what prop firm traders need. Managing my monthly platform and data subscriptions was a headache. Now I can track them all in one place and see my true ROI."
PropTrackerHQ offers a 7-day free trial, with pricing options of $5 per month or $50 annually (a savings of over 15%). The platform is pre-loaded with popular firms like Apex Trader Funding, Topstep, and MyFundedFutures, and it also supports custom entries for other prop trading companies.
6. TradingView

TradingView stands out not just for monitoring performance but also for providing powerful tools that help you analyze and refine your trading strategies. Designed with funded traders in mind, it offers professional-grade charting and analytics, all accessible through a free version - no credit card required.
Performance Tracking Features
With the Portfolios tool, you can streamline the tracking of your assets across various markets. Whether you manually enter positions, import data through CSV/XLSX files, or convert watchlists, this feature helps you calculate essential metrics like total gain, unrealized P&L, and annualized yield. These insights are key to ensuring you meet your growth targets.
The Strategy Tester takes it further by analyzing historical data to deliver over 100 statistical metrics. From profit factor and maximum equity drawdown to win rate and average win/loss ratios, this tool highlights the strengths and weaknesses of your strategy. It even identifies risky behaviors, helping you fine-tune your approach.
Together, these tools provide a solid foundation for assessing risks and refining strategies effectively.
Analytics and Insights for Traders
TradingView offers advanced risk-adjusted metrics like Sharpe, Sortino, and Beta ratios to evaluate whether your returns justify the risks taken. The Sortino ratio, in particular, focuses on downside risk, helping you stay within acceptable drawdown limits.
For a hands-on approach, the Paper Trading feature creates a risk-free testing environment. You can tailor account balances, currencies, commissions, and leverage to match your specific prop firm’s requirements. This allows you to practice strategies and ensure compliance with trading rules before putting real money on the line. Additionally, the Bar Replay tool lets you revisit historical market data, simulating different speeds so you can practice executing trades and build confidence in your setups.
Customization Options for Funded Accounts
TradingView also excels in customization. With Pine Script, you can create personalized indicators and strategies that align with your prop firm’s guidelines. The platform offers access to over 400 built-in indicators and a community-driven library of 100,000 additional tools. You can even set cloud-based alerts for specific price levels, ensuring you never miss critical market movements.
The Portfolios tool further enhances your experience by logging detailed transaction histories, including orders, commissions, deposits, and withdrawals. It also allows you to group assets based on various criteria, helping you avoid overexposure to specific markets. Plus, you can sync your layouts and settings seamlessly across web, desktop, and mobile platforms.
7. Custom Spreadsheet Journal
Creating a custom spreadsheet journal in Google Sheets or Microsoft Excel gives you total control over how you track your trades. Unlike pre-made software, this approach lets you design every column, formula, and alert to fit the specific rules of your prop firm and your trading style. It’s a hands-on solution that pairs well with automated tools but offers even more precision.
Performance Tracking Features
Start with the basics: Date, Symbol, Entry/Exit Prices, Position Size, Direction, and Profit/Loss. Then, layer in risk management details like Risk per Trade (in dollars or percentage), Stop Loss levels, and R-multiples to measure your risk-to-reward ratio. Formulas like SUM for total P&L, AVERAGE for profit per trade, and COUNTIF for tracking win/loss streaks can make your data more actionable. For deeper insights, include metrics like Maximum Adverse Excursion (MAE) and Maximum Favorable Excursion (MFE).
Don’t overlook visuals. Excel and Google Sheets have built-in charting tools to create equity curves and drawdown graphs, helping you spot trends that raw numbers might miss.
Integration with Prop Firm Rules
Custom spreadsheets excel at ensuring compliance with prop firm rules. For example, many firms cap daily losses at 3%–5% and total drawdowns at 6%–10%. You can set up columns to track these limits and use conditional formatting to highlight potential violations. Some firms also enforce consistency rules, like limiting any single trading day to 30%–40% of total profits. A formula like =Max_Day_Profit / Total_Profit can automate this calculation.
Checklists or checkboxes can help you quickly log adherence to specific rules, such as "No Overnight Positions", "Max Contracts", or "News Trading Ban".
"A journal that meets these needs becomes a realtime coach - preventing rule breaches instead of just documenting them after the damage is done." - TradeTrakR
By combining these features, your journal becomes more than a record - it’s a tool for staying disciplined and improving performance.
Analytics and Insights for Traders
Use IF statements to set up real-time alerts when you’re nearing risk thresholds. Weekly expectancy calculations can help you separate luck from execution errors. Research shows that detailed journaling can increase profit factors by 23% for proprietary traders.
Go beyond numbers by tracking behavioral data. Add columns for emotional states (e.g., "confident", "tilted"), market context (like London, NY, or Asia sessions), and volatility conditions. Pivot tables can filter performance by session or setup type, helping you pinpoint the conditions where you perform best. You can also set cooldown triggers - like taking a break after two consecutive rule breaches - to maintain discipline.
Customization Options for Funded Accounts
A custom spreadsheet offers flexibility at no recurring cost. You can create separate sheets for Daily Trades, Monthly Summaries, Risk Management, and Goal Tracking. Google Sheets users can leverage the GOOGLEFINANCE function for real-time price updates.
Google Sheets is free, while Microsoft Excel (part of a Microsoft 365 subscription) provides more advanced offline charting and formula options. Setting up your journal takes about 3–5 hours, with daily updates requiring just 5–10 minutes. The manual entry process can also encourage deeper reflection on each trade.
"A simple journal beats a complex one you never fill out." - Funding Rock
For traders working through multi-phase evaluations, consider using tags or separate tabs to track Phase 1 and Phase 2 progress independently. This approach ensures you have a clear, audit-ready record to share with prop firm support teams, whether for resolving disputes or requesting account scaling.
Tool Comparison Table
Here's a quick side-by-side comparison to help you find the tool that matches your needs - whether it's for automated rule tracking, detailed analytics, or customization options. This table complements the detailed breakdowns provided earlier.
| Tool | Tracking Features | Prop Firm Integration | Analytics Capabilities | Customization Options |
|---|---|---|---|---|
| For Traders Dashboard | Tracks ROI, pass rates, and rule compliance (e.g., drawdown limits, consistency) | Works with major prop firms | Offers unified analytics, payout projections, and calendar heatmaps | Allows custom account sizes and rule presets |
| TradeZella | Includes rule checklists, news filters, session timing, and trailing drawdown tracking | Connects natively with Tradovate, Rithmic, and NinjaTrader | Features replay analytics, mistake tagging, and automated coaching | Offers evaluation mode toggles and reset history |
| Tradervue | Tracks basic P&L, auto-syncs trades, and includes trade notes | Supports API/file imports for major brokers | Provides risk distribution, expectancy, and basic stats | Focused on standard journaling with limited customization |
| TradesViz | Tracks detailed P&L and supports multi-account tracking | Integrates with 40+ brokers via API and CSV | Includes over 30 widgets, trade expectancy, and strategy stats | Offers modular dashboards and custom tags |
| PropTrackerHQ | Tracks net profit (payouts vs. costs) and subscription expenses | Works with pre-listed firms and allows custom firm setups | Provides AI-driven insights, ROI charts, and backtesting reports | Allows custom expense categories and firm names |
| TradingView | Tracks real-time P&L on charts, bracket orders, and daily loss caps | Integrates with Tradovate Prop and other brokers | Offers custom indicators, sentiment tracking, and OrderFlow+ | Highly customizable charts, layouts, and Pine Script |
| Custom Spreadsheet | Manual tracking for P&L and rules | No automatic integration | Limited to user-built formulas and basic charts | Fully customizable but requires significant manual effort |
When choosing a tool, pricing is just as important as functionality. Here's what you can expect:
- For Traders Dashboard: Free for up to 2 accounts, with a Pro plan at $29.99/month.
- PropTrackerHQ: Budget-friendly at $5/month or $50/year.
- TradeZella, Tradervue, and TradesViz: Each costs around $29–$29.95/month.
- Custom Spreadsheet: Only costs your time and effort.
Looking for real-time rule alerts? Go with For Traders Dashboard or TradeZella. If you're on a budget and want AI-driven insights, PropTrackerHQ is the way to go. For complete control, a custom spreadsheet might be your best bet.
Conclusion
Managing a funded trading account requires staying within strict guidelines while keeping a close eye on every dollar you earn and spend. The seven tools discussed here offer various ways to monitor daily loss limits, trailing drawdowns, and net profits after fees and resets. Whether you need instant alerts, centralized dashboards for multiple accounts, or insights into your trading psychology, there’s a tool to match your needs.
Start by deciding what’s most important for your trading business. If you’re juggling accounts across firms like Apex, Topstep, and FTMO, a centralized dashboard can save you time and reduce confusion. If controlling the psychology of trading is a challenge, tools with features like tilt meters and cooldown triggers can help prevent costly mistakes during stressful sessions. For those treating prop trading as a business, expense tracking and ROI calculators can clarify whether your payouts outweigh costs like activation fees and resets.
Take advantage of free trials and affordable options before committing. For example, TradeTrakR offers a 3-day trial, PropTrackerHQ is just $5/month, and the For Traders Dashboard is free for up to two accounts. This allows you to test the interface, ensure compatibility with your workflow, and confirm support for your broker or platform.
Make sure your chosen tool aligns with the drawdown rules of your prop firm - whether it’s trailing from equity peaks or a static drawdown. Miscalculations can lead to unexpected breaches. Tools with auto-sync features can avoid security issues, while exportable logs provide useful documentation for appeals or scaling requests.
FAQs
What’s the best way to choose the right tool for improving my funded trading account performance?
To find the best tool for managing your funded trading account, start by assessing your trading style, objectives, and the specific requirements set by your prop trading firm. Look for tools that provide essential features like performance tracking, risk management, and rule compliance that align with the firm's guidelines.
If you're juggling multiple accounts or need a centralized way to track metrics and organize documents, consider tools built for streamlined account management. For those who prioritize in-depth analytics or psychological insights, platforms offering detailed performance analysis and real-time rule tracking can be incredibly helpful. Focus on features that match your priorities, such as multi-account integration, automatic rule monitoring, or psychological tracking, to ensure the tool supports your trading goals effectively.
What are the key features to look for in tools that help manage risk in a funded trading account?
To manage risk effectively in a funded trading account, it’s crucial to use tools that help you stay on top of drawdowns, enforce trading rules, and offer real-time feedback. Features like automatic rule tracking are especially useful, as they ensure you stick to daily and overall drawdown limits. This can help you avoid costly mistakes, such as account resets or losing your funding.
Tools with real-time analytics are another must-have. They can alert you to potential rule violations or warn you when you’re taking on too much risk, giving you the chance to adjust before losses spiral. It’s also worth leveraging tools that monitor performance and trading psychology. These can highlight emotional tendencies - like overconfidence or frustration - that might push you toward risky decisions. Together, these features encourage disciplined, consistent trading while helping you maintain long-term success.
How can these tools help me follow prop firm rules?
These tools are built to help traders follow prop firm rules by offering real-time monitoring, automated alerts, and easy-to-understand insights into essential trading metrics. They keep an eye on crucial factors like drawdown limits, profit goals, and consistency standards, instantly alerting you if you're close to or crossing firm-specific thresholds.
On top of that, features like trading journals and performance trackers log every trade and decision, creating a detailed record that can be handy for audits or resolving disputes. By encouraging disciplined trading and minimizing the chances of accidental rule-breaking, these tools support your ability to meet performance standards and steer clear of penalties, helping you stay aligned with your funded account objectives.
Related Blog Posts
Start Trading with For Traders
Join our platform to test your trading skills, trade virtual capital, and earn real profits. Access educational resources, advanced tools, and a supportive community to enhance your trading journey.
Start your Trading Challenge