
Want better trading results? Focus on feedback loops. These are systems that help you analyze your trades and improve over time. Instead of obsessing over profits and losses, feedback loops shift attention to things you can control - like planning, execution, and risk management. Here’s a quick breakdown:
- Trade Journal: Journal trades effectively by recording every trade immediately and reviewing weekly. Track patterns, rule adherence, and performance metrics like profit factor and expectancy.
- Pre/Post-Trade Process: Plan your trades before the market opens. Afterward, assess if you followed your plan, not just whether you made money.
- Risk Management: Limit losses with strict position sizing and drawdown controls. Use the 1% rule and adjust size based on account performance.
- Market Regime Awareness: Match your strategy to the current market conditions (trending, choppy, range-bound, or crisis) using tools like ADX and ATR.
Key takeaway: The best traders don’t just trade - they analyze, adjust, and improve continuously.

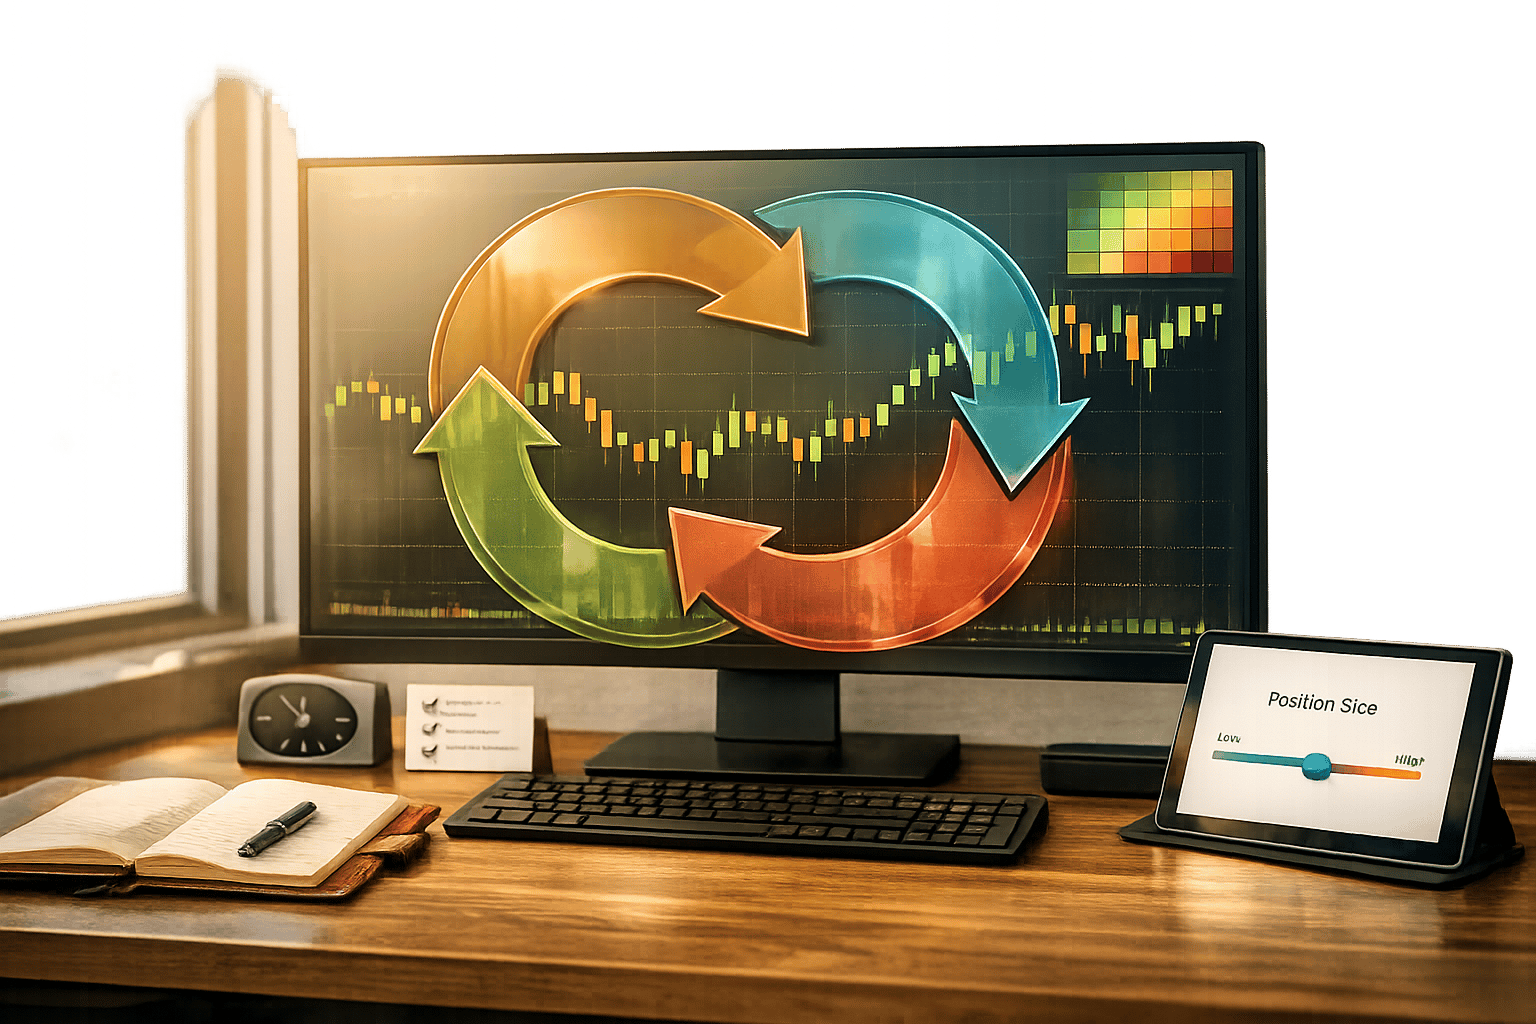
4 Feedback Loops for Better Trading Results
How to Fix Your Trading Problems & Bonus Trade Log
1. Trade Journal and Metrics Review
Keeping a trade journal is essential if you want reliable feedback on your trading performance. Without one, you’re left relying on memory - which fades fast. In fact, research shows that most of us forget key details about our trades within an hour of closing them. That makes it nearly impossible to accurately recall your reasoning later. A trade journal solves this problem by providing a structured way to track and analyze your trades, forming the backbone of any meaningful improvement strategy.
The solution? Log every trade within 60 seconds of closing it. Capture details like price, size, setup type, emotional state, and whether you followed your trading rules and discipline. That last point - rule adherence - is often overlooked but incredibly impactful. Adding a simple Yes/No column for this can reveal patterns that are critical for long-term growth.
"A P&L spreadsheet tells you what. A trading journal tells you why. They are not the same artifact." - Trade Journal AI
After logging 30–50 trades, you’ll start noticing trends. For example, maybe you consistently profit during the New York session but lose money in the afternoons. Or perhaps one particular ticker is dragging down your overall performance. These insights go beyond what raw numbers can tell you. Traders who regularly review their journals tend to improve their performance twice as fast as those who don’t.
Once the journal reveals these patterns, you can dig deeper using key performance metrics:
- Profit factor: This is your gross profit divided by gross loss. A value above 1.5 suggests your trading edge is holding up.
- Expectancy: This metric shows the average dollar amount you can expect to make per trade. Calculate it using the formula: (Win Rate × Avg Win$) − (Loss Rate × Avg Loss$).
- R-multiples: These help standardize results across different instruments and position sizes, making it easier to evaluate setups fairly.
To stay on top of your progress, set aside 20–30 minutes every Sunday for a weekly review. Use this time to identify your three best and three worst trades and pinpoint one actionable adjustment for the week ahead. This habit ensures you’re always learning and refining your approach.
2. Pre-Trade Planning and Post-Trade Debrief
Starting your trading day without a pre-market plan often leads to emotional, impulsive decisions. The fix? complete your chart analysis and mark key levels before the market opens.
A strong pre-trade plan answers three critical questions before you commit any money: Where will I enter? Where will I exit if the trade goes against me (the invalidation point)? And how much will I risk? Your stop-loss should be based on market structure, not an arbitrary dollar amount. To further refine your strategy, use a setup classification system. For example, an "A+" setup that meets all your criteria could justify risking 1% of your capital, while a "B" setup might warrant only 0.5%. Anything below that? Skip it. This discipline is essential when attempting a one-step trading challenge to secure a master account.
"Professionalism is built before the session, not during it." - Jana, Performance Coach, FTMO
One helpful tool is a Scenario Matrix. This involves creating if-then protocols to guide your entries and manage risk. Instead of trying to predict market moves, you’ll react mechanically when your predefined conditions are met. The same logic applies to handling emotions: set rules like "pause trading for 20 minutes after two consecutive losses" to avoid spiraling into emotional trades.
Once the trading session ends, shift your focus to a detailed post-trade debrief.
Within 30 minutes to 2 hours after closing a trade, review it while the details are still fresh. Don’t just look at profit or loss - evaluate whether you stuck to your plan. A trade that loses money but follows your rules is far better than a winning trade made on impulse. Grade each trade based on how well you adhered to your plan, note your emotional state (e.g., Calm, FOMO-driven, or Revenge-focused), and track metrics like MAE (Max Adverse Excursion) and MFE (Max Favorable Excursion) to improve your exit strategies over time. According to research, traders who document their routine this way see a 23% improvement in consistency scores compared to those who don’t.
Wrap up your debrief by identifying one specific, measurable adjustment to implement moving forward.
3. Risk Management and Drawdown Controls
Even the most well-thought-out trading plan can fail without proper position sizing. Risk management acts as the safety net, preventing minor mistakes from spiraling into catastrophic losses.
Consider this: a 10% drawdown requires an 11.1% gain to recover, while a 50% drawdown demands a staggering 100% gain to break even. This imbalance underscores the importance of protecting your capital. As Ed Seykota, a well-known Market Wizard, wisely said:
"The key to long-term survival and prosperity has a lot to do with the money management techniques incorporated into the technical system."
To limit losses, follow strict risk protocols. One effective strategy is the 1% rule - risk no more than 1% of your total account equity on any single trade. This approach allows you to withstand up to 100 consecutive losses without depleting your account. By comparison, risking 3% per trade could lead to a 26.3% capital loss after just 10 losing trades. Traders who establish daily loss limits of 2–3% tend to experience drawdowns that are about 34% lower than those who don't set such limits.
When losses occur, it’s critical to adjust your trading size. A tiered approach can help manage risk effectively:
- Trade at full size if your account is within 5% of its peak.
- Reduce position size to 75% when your account is down 5–10%.
- Cut position size to 50% when down 10–20%.
- Stop live trading entirely if your drawdown reaches 20%.
This final step isn’t a sign of failure - it’s a safeguard. As Louw van Riet, a trader and author, aptly put it:
"The professional trader's goal is not to maximise the return on any single trade. It is to still be trading five years from now."
Another important aspect is monitoring portfolio heat, which refers to the total risk from all open positions. When trading correlated assets, like multiple USD pairs, your overall exposure can be much higher than it seems. To manage this, cap your total open risk at 6–10% of your account and limit exposure to any single currency or sector to 3–5%. Regularly reviewing and fine-tuning these controls ensures you stay on track for long-term trading success.
4. Market Regime and Strategy Adaptation
There’s no such thing as a one-size-fits-all trading strategy, and traders often must choose between momentum vs mean reversion strategies. A trend-following system might perform well during rallies but struggle in sideways markets. Meanwhile, a mean-reversion approach tends to falter during prolonged trending moves. As day trader Arlette aptly put it:
"Strategies fail for one primary reason: environmental mismatch."
The solution isn’t about chasing a "perfect" strategy - it’s about understanding the market environment you’re in and adjusting your approach accordingly.
Markets typically cycle through four states: trending, choppy, range-bound, and crisis. An analysis of S&P 500 data from 2000 to 2024 reveals that the market spends about 38% of the time trending, 29% in choppy conditions, 19% range-bound, and 14% in crisis mode. Recognizing these patterns early can give traders a meaningful edge.
Two key tools can help identify the market environment: the ADX (Average Directional Index) and the ATR (Average True Range). The ADX measures trend strength - values above 25 suggest a trending market, while readings below 20 point to a range-bound one. The ATR, on the other hand, gauges volatility. A rising ATR indicates expanding volatility, while a falling ATR signals contraction. When combined, these indicators provide a clearer view of the market than either could on its own.
Understanding the current regime can dramatically boost strategy performance. For example, a momentum strategy applied to the S&P 500 achieves a Sharpe ratio of 1.4 during trending periods. However, the same approach struggles in choppy, mean-reverting conditions, with its Sharpe ratio plummeting to -0.3. Similarly, trend-following systems often suffer losses of 15%–30% from whipsaws in range-bound markets. These aren’t flaws in the strategies themselves - they’re mismatches with the market regime.
Think of strategy selection as passing through a "regime gate." When the ADX signals a strong trend, focus on momentum and breakout setups. If the ADX drops below 20 and prices oscillate between support and resistance, shift to mean-reversion tools like RSI. And during crisis periods - marked by high volatility and correlations nearing 1.0 across assets - scale back position sizes significantly and prioritize protecting your capital over chasing profits.
"The market doesn't announce 'we are now in a different regime.' It simply starts behaving differently, and your old playbook stops working." - EKX.AI
To build a resilient trading framework, integrate this adaptive approach with consistent journaling, detailed planning, and disciplined risk management.
Putting the Four Feedback Loops Together
The four feedback loops work together to create a self-correcting trading process. The real power comes from combining them into a continuous cycle: Plan → Execute → Analyze → Adjust. Each trade becomes a stepping stone for the next, transforming trading from a series of isolated events into a dynamic process of constant improvement.
"The difference between traders who improve and traders who stagnate is the quality of their feedback loops. Not intelligence. Not strategy. Not even experience." - Thrive
This approach emphasizes the process over the outcome. A well-executed trade that results in a loss is still a success, while a win that breaks the rules is a red flag, not a triumph. Van Glass, Founder of Finbotica, explains it well:
"A good decision can lead to a bad outcome. A bad decision can get rewarded. Without a structured way to separate process from result, investors fall into a pattern of reinforcing whatever just happened."
Daily reviews help traders catch immediate mistakes, weekly reviews highlight behavioral trends, and monthly reviews validate the overall effectiveness of their strategies. When these feedback loops are integrated, they create a strong framework that connects planning, execution, and adaptation.
Platforms designed for continuous trading improvement make this process easier. For example, For Traders offers tools like simulated trading challenges, an integrated trade journal, and an AI Coach that provides actionable advice. The platform also includes High Performance Coaching and a Discord community for daily peer feedback. With over $9 million paid out to more than 80,000 customers across 130+ countries, its results speak for themselves.
As Naval once said:
"It isn't 10,000 hours that creates outliers, it's 10,000 iterations."
FAQs
What should I journal if I’m too busy to log everything?
If you're pressed for time, prioritize recording the essential trade details: entry and exit points, the instrument traded, and the name of the setup. To save time, take advantage of automated export features provided by your trading platform instead of logging everything manually. During trading sessions, jot down quick notes about your emotional state and whether you stuck to your rules. Then, dedicate 30 minutes each week to reviewing these entries in bulk. This will help you spot patterns across your trades more effectively.
How do I set my stop-loss without using a fixed dollar amount?
To set a stop-loss without anchoring it to a fixed dollar amount, focus on market dynamics or volatility. One approach is to pinpoint critical price levels that would invalidate your trade idea - such as just below a recent swing low or above a notable resistance level. Another method involves using the Average True Range (ATR). A common practice is to set the stop-loss at 1.5 to 2 times the 14-period ATR, accounting for typical market movement.
Once you've determined the stop-loss level, calculate your position size by factoring in both the percentage of your account you're willing to risk and the distance between your entry price and the stop-loss. This ensures your trade aligns with your overall risk management strategy.
How can I tell when to switch strategies for a new market regime?
When the market no longer reflects the conditions your strategy was built for, it's time to adjust. Watch for key signals like:
- Volatility shifts: For example, when the 20-day ATR moves above or below the 60-day average.
- Trend versus range changes: Use the ADX to gauge this. Values above 25 indicate a trending market, below 20 suggest a ranging market, and 20–25 often signals a transition.
- Bollinger Band width changes: Look for expansions or compressions in the bands to identify shifts in market behavior.
To avoid overreacting, confirm these changes with a cooldown period before fully switching strategies.
Related Blog Posts
Start Trading with For Traders
Join our platform to test your trading skills, trade virtual capital, and earn real profits. Access educational resources, advanced tools, and a supportive community to enhance your trading journey.
Start your Trading Challenge