

Creating a trading algorithm starts with one thing: quality data. Without accurate, reliable data, even the best code can fail. This article covers 10 key data sources for traders, each offering different strengths like historical data, real-time feeds, or affordability.
Key Takeaways:
- Quandl (Nasdaq Data Link): Offers historical and alternative datasets for equities, forex, and more. Supports Python, R, and Excel. Pricing varies by dataset.
- Alpha Vantage: Provides 20+ years of historical data and real-time feeds for stocks, forex, and crypto. Free tier available; premium starts at $29/month.
- Yahoo Finance: Free historical data since 1970 but limited real-time options. Best for quick prototyping.
- Polygon.io (Massive): Low-latency real-time data for high-frequency trading. Plans start at $29/month.
- Intrinio: Focuses on U.S. assets with deep historical data. Pricing starts at $3,000 annually.
- Tiingo: Affordable historical data for stocks and ETFs. Plans start at $10/month.
- EOD Historical Data: 30+ years of global data for stocks, forex, and more. Starts at $19.99/month.
- Interactive Brokers API: Combines market data with live trading. Requires funded account; subscription costs vary.
- Finnhub: Offers global coverage, sentiment data, and 30+ years of history. Free tier available; premium starts at $49/month.
- For Traders: Simulated trading with live data for strategy testing. One-time fees range from $46 to $413.
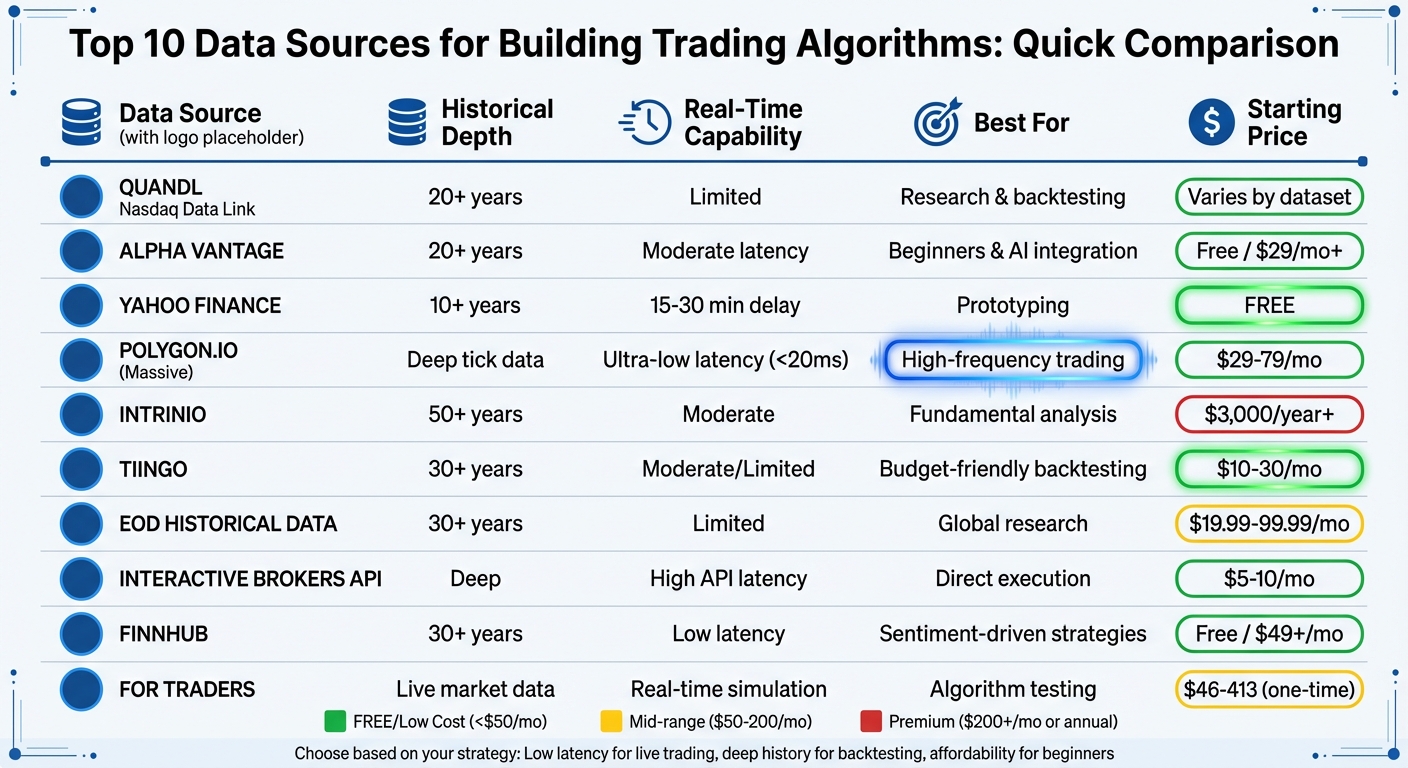
Quick Comparison
| Data Source | Historical Depth | Real-Time | Assets Covered | Pricing | Best For |
|---|---|---|---|---|---|
| Quandl | 20+ years | Limited | Equities, Forex, Alt Data | Varies by dataset | Research & backtesting |
| Alpha Vantage | 20+ years | Moderate latency | Stocks, Forex, Crypto | Free; $29/month+ | Beginners |
| Yahoo Finance | 10+ years | 15–30 min delay | Stocks, ETFs, Indices | Free | Prototyping |
| Polygon.io (Massive) | Deep tick data | Ultra-low latency | US Stocks, Forex, Crypto | $29–$79/month | High-frequency trading |
| Intrinio | 50+ years | Moderate | US Stocks, Options | $3,000/year+ | Fundamental analysis |
| Tiingo | 30+ years | Moderate | Stocks, ETFs, Forex | $10–$30/month | Budget-friendly backtesting |
| EOD Historical Data | 30+ years | Limited | Global Stocks, Forex | $19.99–$99.99/month | Global research |
| Interactive Brokers | Deep | High API latency | Stocks, Forex, Futures | $5–$10/month | Direct execution |
| Finnhub | 30+ years | Low latency | Stocks, Sentiment, Insider | Free; $49+/month | Sentiment-driven strategies |
| For Traders | N/A | Real-time simulations | Demo accounts | $46–$413 (one-time) | Backtest a strategy in MT5 |
Choose a data provider based on your needs - whether it’s low-latency real-time data for live trading, deep historical data for backtesting your trading strategy, or affordable options for beginners.
Top 10 Trading Algorithm Data Sources Comparison Chart
Find Your Ideal Data Sources for Algorithmic Trading
1. Quandl
Quandl, now operating as Nasdaq Data Link, offers an extensive collection of financial datasets tailored for quantitative traders. It includes both traditional market data and alternative datasets, ensuring the reliability required for backtesting and live trading setups. Below, we’ll explore its historical data depth, asset coverage, API compatibility, and pricing structure.
Historical Data Depth
Quandl provides extensive historical data across various asset classes, making it a valuable tool for backtesting in MT5. The data is structured into time-series formats for prices and volumes, as well as tables for fundamentals and alternative data. Free datasets include resources like WIKI, FRED, and CFTC Commitment of Traders Data. For those seeking institutional-grade information, premium options such as QuoteMedia End of Day US Prices and Sharadar Core Fundamentals are available.
Asset Coverage
Quandl’s datasets span multiple asset types. For equities, it offers daily price data, corporate actions, and comprehensive fundamentals like income statements, balance sheets, and cash flow reports. Additional coverage includes forex rates, futures, options, and global equities, with data from key markets like the US, UK, and China. Quandl also delivers macroeconomic indicators such as CPI, PMI, employment statistics, and commodity prices.
API Language Support
Quandl’s API supports multiple programming languages, including Python, R, and Excel. It also integrates seamlessly with platforms like QuantConnect using Python and C#. As Nasdaq Data Link explains:
"Through our APIs and various tools (R, Python, Excel, etc.), users can access the premium data to which they have subscribed".
Pricing Tiers and Affordability
Quandl operates on a per-dataset subscription model. Free-tier users can access datasets like FRED and End of Day US Stock Prices, while premium subscriptions unlock high-quality data such as Zacks Earnings Estimates and Sharadar Core Fundamentals. Users can also filter the catalog to find free datasets that meet their needs.
2. Alpha Vantage
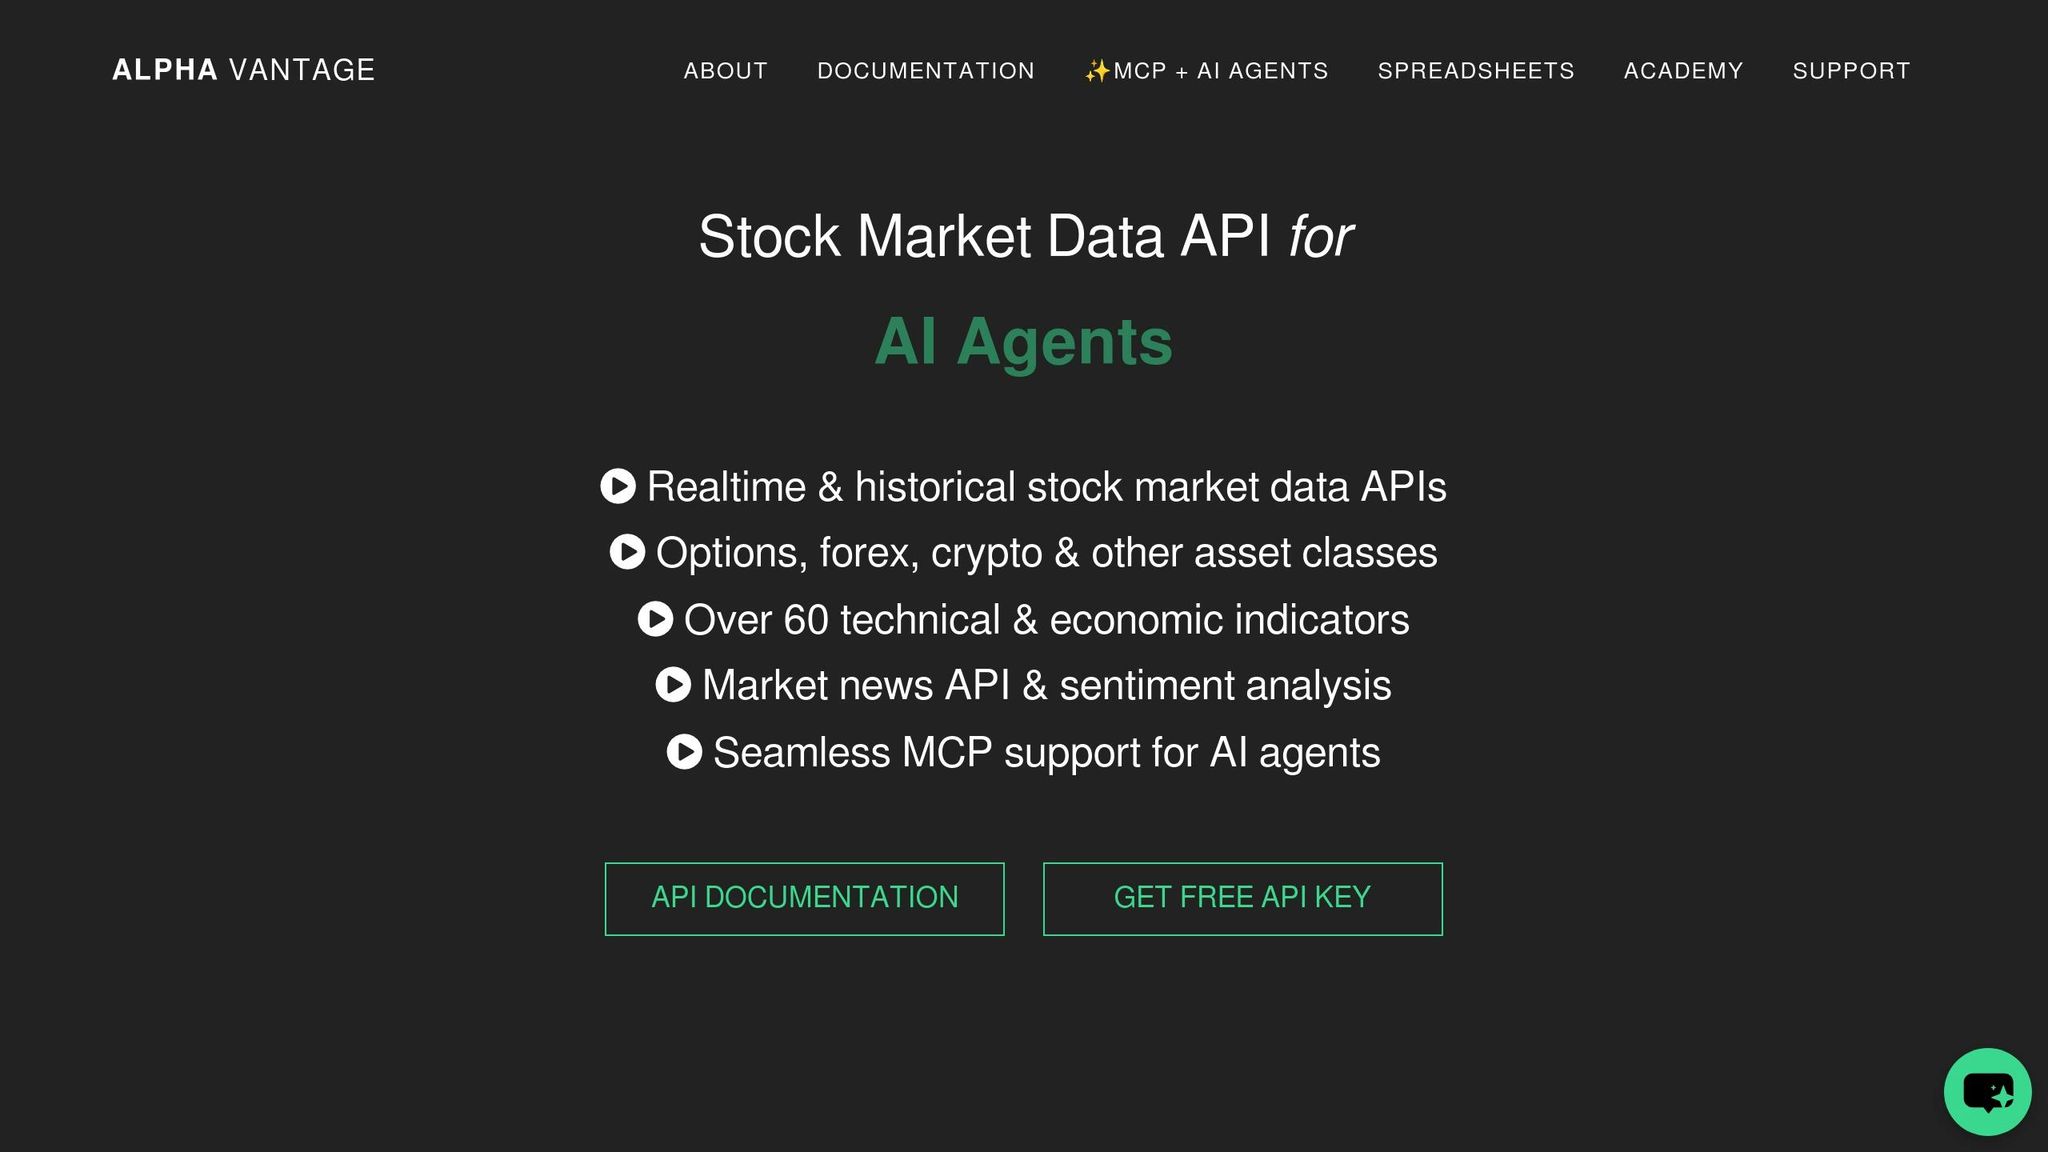
Alpha Vantage is a Nasdaq-licensed provider delivering both real-time and historical market data across a variety of asset classes. This makes it a strong foundation for developing algorithms, thanks to its extensive range of data options.
Historical Data Depth
Alpha Vantage provides over 20 years of historical data, starting from January 2000, in formats like intraday, daily, weekly, and monthly. You can access intraday OHLCV data for specific months, covering both regular and extended trading hours (4:00 am to 8:00 pm ET). The data is available in as-traded and split/dividend-adjusted formats, adhering to industry-standard methods [3,19]. Beyond price data, the platform offers over 15 years of earnings call transcripts, along with datasets for economic indicators, forex, and cryptocurrencies.
Real-Time Data Availability
For those needing up-to-the-minute information, Alpha Vantage provides real-time and 15-minute delayed US market data through its premium plans. Being exchange-licensed ensures the data is accurate and legally compliant.
As Alpha Vantage states:
"Alpha Vantage is a Nasdaq-licensed provider of realtime and 15-minute delayed US market data".
Asset Coverage
Alpha Vantage supports more than 100,000 symbols, including global stocks, ETFs, mutual funds, US options, forex (with crypto), commodities, and economic indicators. Stock data is sourced from over 20 global exchanges, covering regions like the US, UK, Canada, Germany, India, and China. The API also provides access to over 50 technical indicators, as well as macroeconomic data such as GDP, treasury yields, inflation, and unemployment rates. This broad coverage makes it a valuable tool for both backtesting and live trading strategies.
API Language Support
The platform offers extensive language support, with code samples available in Python, JavaScript, PHP, and C#. Additionally, there are over 1,000 community-built libraries across 20+ programming languages [3,16]. Alpha Vantage also integrates seamlessly with tools like Microsoft Excel (Office 365) and Google Sheets and includes an official MCP server for embedding market data into AI applications [3,16].
Pricing Tiers and Flexibility
Alpha Vantage’s free tier provides lifetime access to most datasets, with a daily limit of 25 requests. Premium plans unlock features like real-time US market data, 15-minute delayed data, and complete historical archives. Known for its affordability, Alpha Vantage is an attractive option for algorithmic traders, especially those working within a budget. Business users can contact the sales team for tailored onboarding and compliance solutions.
3. Yahoo Finance
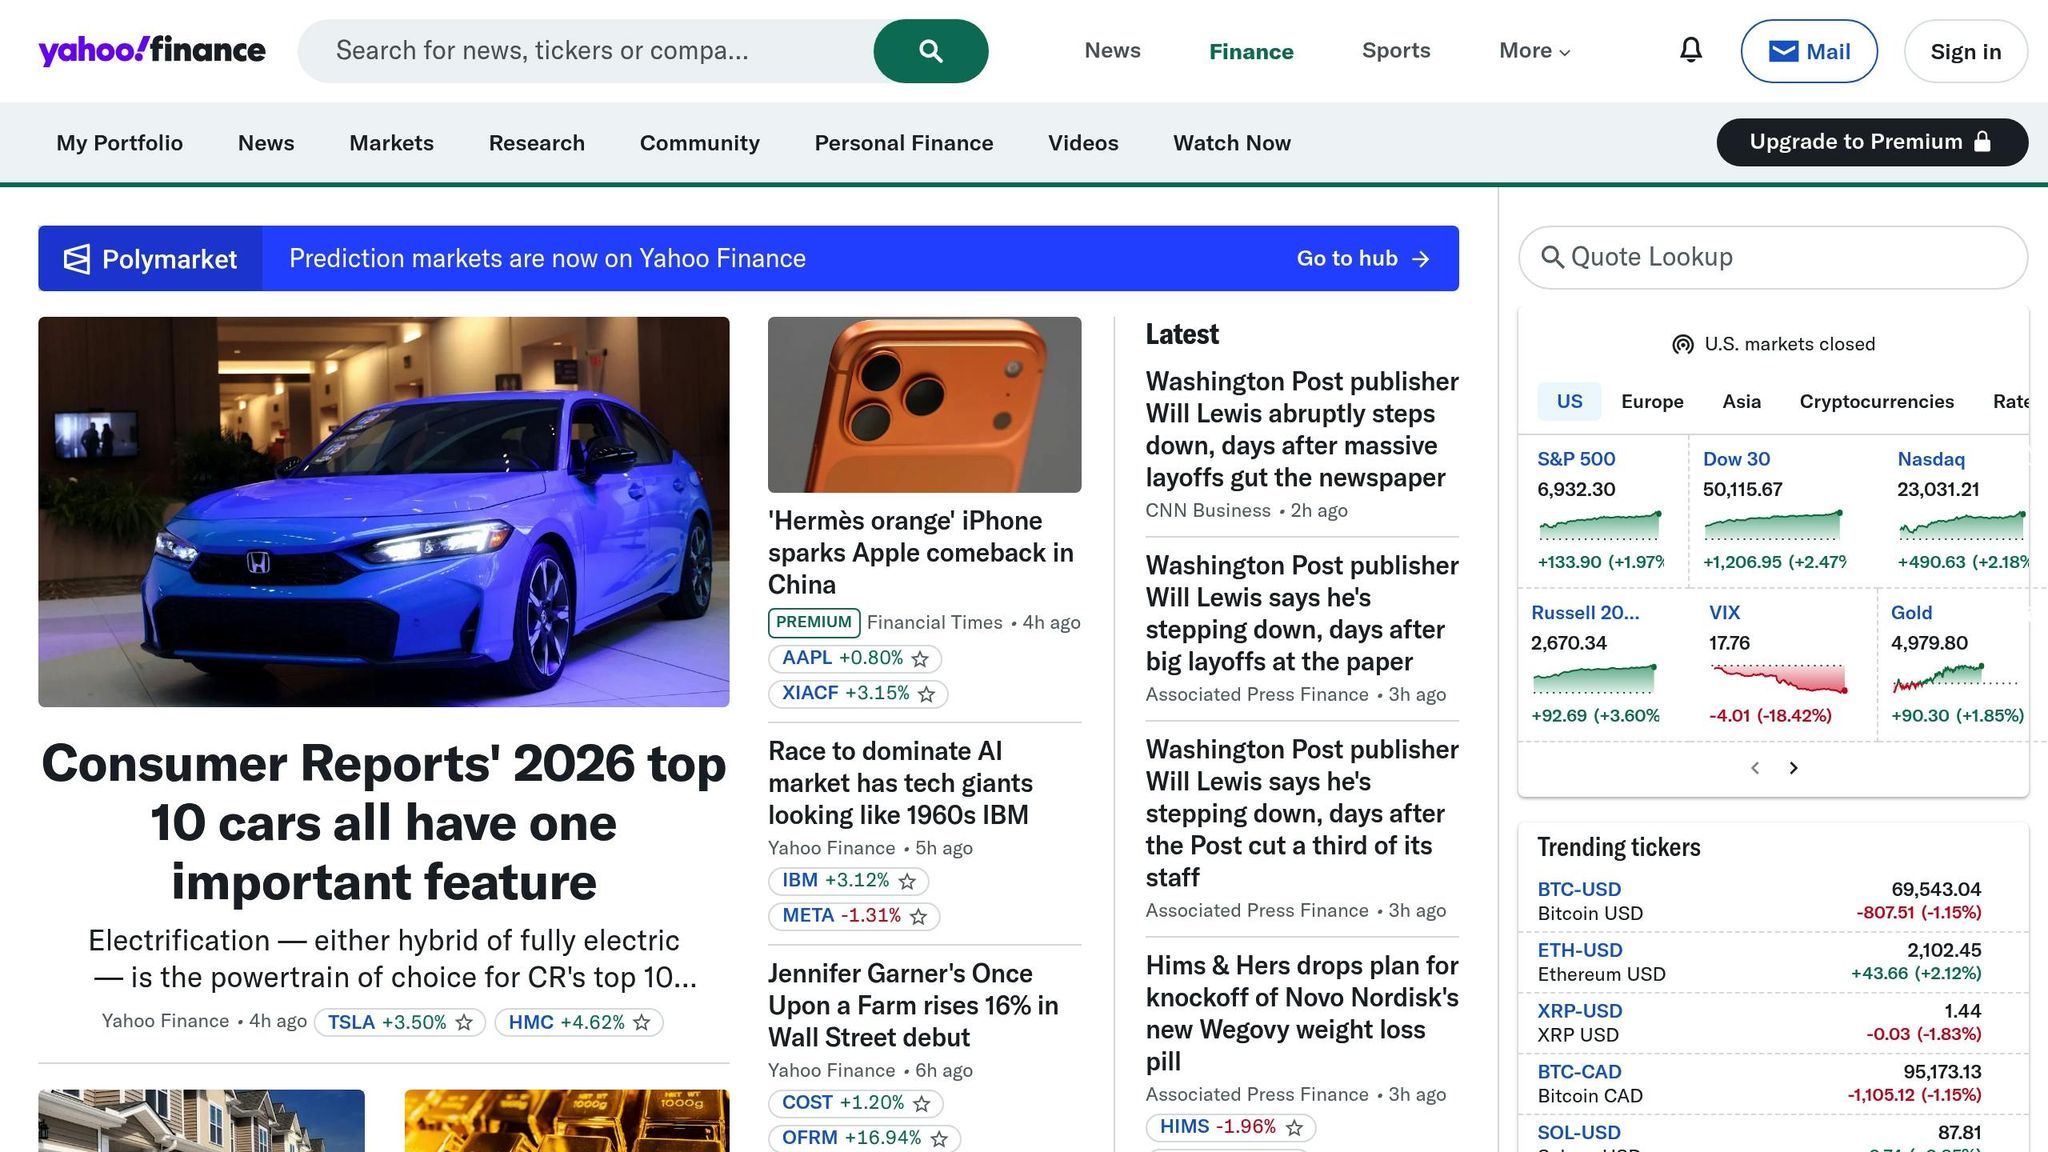
Yahoo Finance has been a favorite among traders looking for free market data, but there are some limitations to keep in mind when using it for trading algorithms.
Historical Data Depth
Yahoo Finance provides historical price data, including dividends and stock splits, dating back to 1970 for backtesting entry and exit rules. Data can be accessed in daily, weekly, or monthly formats. Additionally, the platform offers fundamental data such as balance sheets, cash flow statements, and income statements. However, downloading this data as a CSV file requires a Yahoo Finance Gold subscription, and certain instruments may be unavailable due to licensing restrictions.
Real-Time Data Availability
After the official API was discontinued in 2017, real-time data is now accessed through unofficial libraries like yahoo_fin or third-party APIs. These methods typically rely on web scraping, which can be unreliable due to issues like rate limits, blacklisting, or changes to the website structure.
Asset Coverage
Yahoo Finance covers a wide range of assets from over 50 countries. This includes global stocks, bonds, forex, cryptocurrencies, mutual funds, ETFs, options, and futures. Real-time cryptocurrency data is sourced from CoinMarketCap, while real-time forex rates and U.S. indices (e.g., Nasdaq, Dow Jones, and S&P 500) come from ICE Data Services. For international exchanges, there are delays - typically 15 to 30 minutes, depending on the market. For example, the London Stock Exchange and Tokyo Stock Exchange data are delayed by about 20 minutes. This broad asset coverage allows for diverse trading opportunities.
API Language Support
Python is the most commonly used language for accessing Yahoo Finance data through unofficial libraries like yfinance and yahoo_fin. Third-party APIs also support more than 15 programming languages, including Java, JavaScript, and PHP. However, free tiers often impose limits, such as capping usage at approximately 500 requests per month.
Pricing Tiers and Affordability
One of Yahoo Finance's biggest draws is that it offers free access through its website and open-source Python libraries. However, its reliability may not meet the needs of traders working on mission-critical systems. As Greg Bland from AlgoTrading101 puts it:
"The Yahoo Finance API is excellent if you are a relative beginner and just want to get your feet wet/test out some ideas quickly... However, if you are planning to build a more complex and long term system, we'd recommend going with another option".
For traders looking to develop advanced, long-term systems, it might be worth exploring more stable, official data providers.
4. Polygon.io
Polygon.io, now rebranded as Massive as of October 30, 2025, continues to support all its APIs and integrations seamlessly. The platform has become a go-to for traders and developers due to its ability to handle the intense demands of modern trading algorithms. With a 99.99% uptime and the capability to process over 70 million messages per second, it stands out as a reliable source for institutional-grade market data.
Historical Data Depth
Massive offers an expansive range of historical data, covering:
- Stocks: Data available since 2003, encompassing over 32,000 tickers.
- Options: Records dating back to 2014, with 1.67 million+ contracts.
- Forex and Crypto: Starting from 2009, with data on 1,750+ pairs.
- Futures: Available since 2017, including 361,000+ contracts.
- Indices: Coverage beginning in 2023, featuring 11,409+ global indices.
This historical data can be accessed through RESTful APIs, which support automatic price adjustments, or as raw, compressed CSV files via an S3-compatible interface [27,30].
Real-Time Data Availability
Massive excels in delivering real-time data through WebSocket streaming, offering trades, quotes, and aggregates with sub-20ms latency [26,32]. Its infrastructure is strategically co-located in exchange data centers and uses direct fiber cross-connects, ensuring it meets the stringent requirements of high-frequency trading. Fergus Colleran, Ops Manager at Wealth & Trading, highlighted the platform’s reliability:
"Massive APIs have set the standard for easy access to financial market data, and have proven to be extremely robust and reliable over the course of our partnership".
Asset Coverage
The platform provides comprehensive asset coverage to meet the precision needs of trading algorithms. It ensures 100% U.S. market coverage, including all 19 major stock exchanges, dark pools, and OTC markets. Data is sourced directly from Securities Information Processors (SIPs), ensuring nanosecond precision timestamps [30,33,34]. Beyond stocks, the API also supports options chains, forex pairs, cryptocurrencies, futures contracts, and global indices.
API Language Support
Massive offers official libraries for Python, Go, Kotlin, and JavaScript, simplifying tasks like authentication, error handling, and data parsing.
Pricing Tiers and Affordability
Massive's pricing is straightforward, with monthly plans that cater to various needs:
- Basic (Free): 5 API calls per minute, end-of-day data with 2 years of history.
- Starter ($29/month): Unlimited calls, 5 years of historical data, and 15-minute delayed WebSocket access.
- Developer ($79/month): Unlimited calls, 10 years of historical data, and enhanced trade-level detail.
- Advanced ($199/month): Unlimited calls, 20+ years of historical data, real-time access, and financial ratios.
5. Intrinio

Intrinio is a developer-friendly platform tailored for algorithmic trading. It prioritizes clean data and a dependable infrastructure, boasting 99.99% uptime and a median API response time of just 20ms. This level of reliability is critical for traders who need uninterrupted data access for both backtesting and live execution.
The platform offers a rich combination of real-time and historical data designed to meet the needs of algorithmic traders.
Historical Data Depth
Intrinio provides over 50 years of dividend- and split-adjusted stock price history, making it a valuable resource for validating trading strategies. For fundamental analysis, the platform includes more than 15 years of standardized and as-reported financial statement data for U.S. publicly traded companies. Options traders benefit from access to both end-of-day and intraday historical options data, complete with Greeks and implied volatility metrics, enabling detailed backtesting. For even more granular analysis, the "Stock Prices Tick History" feed offers 10-minute snapshots and 1-, 10-, and 15-minute bars, ideal for high-frequency trading simulations.
Real-Time Data Availability
Intrinio supports real-time equities pricing through Nasdaq Basic, IEX Real-Time, and EquitiesEdge, all delivered via WebSocket streaming with a median latency of 150ms. For traders looking to save on costs, the "15-Min Delayed SIP" feed provides 100% market volume at a lower price point. Additionally, the platform features a dedicated API endpoint for technical indicators like RSI, MACD, and Bollinger Bands, eliminating the need for manual calculations.
Asset Coverage
Intrinio's data focuses primarily on U.S. assets, covering stocks, options, ETFs, mutual funds, and over 450 global indices. For ETFs, the platform offers detailed metadata that includes more than 118 unique attributes per fund. However, it’s worth noting that forex and cryptocurrency data are not part of the core product offerings at this time.
API Language Support
To streamline development, Intrinio provides official SDKs for Python, Java, JavaScript, C#, R, and Ruby. Its RESTful API returns data in standard JSON format, making it compatible with any programming language that supports HTTPS requests. Developers often highlight the platform's clear documentation and responsive technical support. As one developer from Alquant shared:
"The documentation is clear, the data quality is good, and the support team is very reactive."
Pricing Tiers and Affordability
Intrinio's pricing starts at $750 per quarter ($3,000 annually) for entry-level datasets, with institutional packages reaching up to $60,000 per year for multi-product solutions. Some specific annual pricing includes EOD Historical Stock Prices at $3,100, IEX Real-Time Stock Prices at $6,000, Stock Prices Tick History at $6,000, and Nasdaq Basic (Real-Time) at $9,000. The platform also offers a two-week free trial for most datasets, and enterprise users benefit from a standard request limit of 2,000 API calls per minute. With its extensive data offerings and reliable API performance, Intrinio is a strong contender for traders focused on both backtesting and live execution.
6. Tiingo
Tiingo provides data on more than 80,000 assets worldwide, focusing on delivering high-quality information through a proprietary error-checking system. This system is designed to identify and fix anomalies, ensuring data integrity. As the company explains:
"Our firm uses a proprietary error-checking framework that helps us clean data, catch missing events, and create redundant feeds."
Let’s dive into Tiingo's historical data range, real-time capabilities, API options, and pricing structure.
Historical Data Depth
Tiingo offers extensive historical data, including end-of-day stock prices dating back to 1962. This includes 37,319 U.S. and Chinese stocks and 45,149 ETFs and mutual funds. Financial statement data spans over two decades, with free users accessing up to 5 years and paid users benefiting from 15+ years of records. Tiingo’s News API features a massive archive of over 50 million articles from the late 1990s, while second-by-second updates are available for approximately 10,000 U.S. equities starting January 2014. For forex, data begins in 2020, covering 140+ currency pairs sourced from tier-1 banks and FX dark pools.
Real-Time Data Availability
Real-time data is a key feature, especially for U.S. equities, supported by a partnership with the Investors Exchange (IEX) using WebSocket streaming. The platform also provides real-time updates for cryptocurrencies and forex using WebSocket technology. Tiingo tracks over 2,100 cryptocurrency tickers across 40+ exchanges, offering both streaming and detailed intraday historical data.
API Language Support
Tiingo supports developers with official libraries for Python (tiingo-python) and R (Riingo), and it integrates seamlessly with pandas_datareader. Additionally, it’s compatible with QuantConnect, allowing users to develop algorithms in Python and C#. Data is available in JSON and CSV formats through REST and WebSocket protocols, with CSV often being 4–5 times faster due to reduced bandwidth needs.
Pricing Tiers and Affordability
Tiingo’s free tier provides 30+ years of historical stock data and 5 years of fundamental data, with limits of 500 symbols per month, 50 requests per hour, and 1,000 requests daily. For $10 per month, the Power User plan removes symbol limits and increases capacity to 5,000 requests per hour and 50,000 requests daily.
"We believe in simple, transparent pricing that makes sense."
For businesses, Tiingo offers commercial and redistribution licenses at straightforward flat rates, catering to both startups and larger enterprises.
7. EOD Historical Data
EOD Historical Data (EODHD) provides professional-grade financial data at prices accessible to individual traders and small teams. Established in April 2015 and headquartered in France, the platform now supports over 30,000 tickers worldwide. It boasts an impressive composite rating of 4.7/5 from 43 reviews. As Quantpedia highlights:
"EODHD.com is one of the best value-for-money financial data providers – a one-stop shop for API endpoints offering 30+ years of historical and live data for stocks, forex, and more."
This blend of affordability and reliability makes EODHD a strong choice for traders seeking dependable market data.
Historical Data Depth
EODHD offers an extensive archive of over 30 years of historical data for stocks and forex, making it a valuable tool for backtesting long-term strategies. Beyond pricing data, the platform includes more than 20 years of financial reports, such as earnings, balance sheets, income statements, and cash flow statements. It even incorporates data for delisted companies, helping to reduce survivorship bias in analyses. All data is automatically adjusted for splits and dividends, ensuring accuracy in backtesting [54,55].
Real-Time Data Availability
EODHD supports various data frequencies, including real-time, delayed, and end-of-day (EOD) data. While its strengths lie in historical and EOD data, the platform does not provide advanced tick-level or full order book data. However, high-granularity tick data for U.S. stocks is available through WebSocket connections, enhancing its appeal for certain use cases [54,55].
Asset Coverage
The platform covers a wide range of assets, including equities, bonds, forex, options, ETFs, and mutual funds. Advanced packages expand this offering with features like 40,000 stock logos and enhanced fundamental data for global tickers. While its primary focus is on traditional assets like equities and forex, EODHD also offers cryptocurrency data, albeit with less emphasis. This broad asset coverage equips algorithm developers with the data they need for both backtesting and live trading [54,55].
API Language Support
EODHD's data is accessible through a REST API, with official libraries available for Python, Java, C#, MATLAB, R, Curl, and PHP. For those without coding experience, the platform offers no-code solutions, including Excel and Google Sheets add-ons and Windows plugins. Data can be downloaded in JSON or CSV formats, and a bulk download feature simplifies the process of building local databases [54,55].
Pricing Tiers and Affordability
EODHD's pricing structure makes its robust features even more appealing. Plans start at $19.99 per month for the "EOD All World" package, which includes 30+ years of historical data and up to 100,000 API calls per day. The "All In One" package, priced at $99.99 per month, provides access to all datasets, news feeds, and stock logos. Plans also support up to 1,000 API calls per minute and include 24/7 live support. Academic users can benefit from discounts of up to 50%. Johnny Zhao underscores the platform's reliability:
"EODHD offers some of the most accurate pricing data I've seen. Its quality is consistent."
8. Interactive Brokers API
Interactive Brokers (IBKR) provides an API that connects traders directly to its brokerage platform, which spans 170 markets across 40 countries. Unlike standalone data providers, the IBKR API combines market data with live order execution capabilities. This dual functionality makes it a go-to option for traders who want to seamlessly backtest strategies and deploy them without juggling multiple platforms.
Historical Data Depth
IBKR offers a robust selection of historical data, including OHLCV candlesticks, tick-by-tick time and sales, and trading schedules. The API supports various data formats like TRADES (split-adjusted), ADJUSTED_LAST (adjusted for both dividends and splits), MIDPOINT, BID, ASK, and specialized metrics such as HISTORICAL_VOLATILITY and OPTION_IMPLIED_VOLATILITY. The depth of historical data varies depending on the instrument, but traders can use the IBApi.EClient.reqHeadTimeStamp function to programmatically check the earliest available data point for a specific contract.
One thing to note: IBKR filters certain trade types - like block trades and odd lots - that occur outside the National Best Bid and Offer (NBBO). As a result, historical volume figures may appear lower compared to unfiltered real-time feeds.
Real-Time Data Availability
The API delivers real-time streaming data with highly detailed update frequencies. Stocks and futures receive updates every 250 milliseconds, U.S. options every 100 milliseconds, and forex pairs every 5 milliseconds. Additionally, tick-by-tick data is available for most asset classes, except options. The platform supports both Level I (top of book) and Level II (market depth) data, along with 5-second real-time bars. However, historical data access requires an active Level 1 streaming subscription for the instrument in question - if you can't see the data in your TWS charts, it won't be available via the API.
Asset Coverage
The IBKR API supports a wide range of asset classes, including stocks, futures, options, forex, cryptocurrencies, bonds, ETFs, commodities, metals, indices, funds, and CFDs. For cryptocurrency, the API offers a specialized "AGGTRADES" data type. However, users need the appropriate trading permissions and market data subscriptions for each asset class.
API Language Support
The TWS API supports multiple programming languages, including C++, C#, Java, Python, ActiveX, RTD, and DDE. This flexibility allows traders to build algorithms in their preferred programming environment. IBKR also offers educational resources like coding courses for Python and R through its Traders' Academy.
For integration, IBKR provides three options:
- TWS API: Prebuilt libraries for algorithmic trading and automating TWS features.
- RESTful Web API: Includes WebSocket streaming for modern applications.
- FIX API: Designed for institutional-level, high-speed order routing.
As IBKR explains:
"Our trading oriented API allows you to develop applications in C++, C#, Java, Python, ActiveX, RTD or DDE. Utilize prebuilt libraries to automate features in TWS UI or develop your own interface."
Pricing Tiers and Affordability
IBKR's pricing operates on a subscription model tied to exchange-specific data packages. A funded account is typically required to access market data, with the exception of forex and bonds. Subscriptions are billed at a full monthly rate without proration. By default, traders can make 100 simultaneous market data requests, but this limit can be increased by purchasing "quote booster packs" or maintaining higher account equity and commission levels.
Market data subscriptions can also be shared with paper trading accounts, enabling traders to test their algorithms with live data risk-free. Additional costs may include commissions, margin and interest rates, research and news fees, and short sale costs.
9. Finnhub
Finnhub stands out as a robust data source for algorithmic trading, offering a blend of historical depth and real-time capabilities. Developed by former engineers from Bloomberg, Google, and Tradeweb, the platform is designed to deliver 99.99% uptime, with Service Level Agreements available for enterprise clients. Its comprehensive data coverage spans multiple asset classes, making it a go-to choice for traders and analysts alike.
Historical Data Depth
Finnhub provides an impressive range of historical data. For the U.S. market, it offers over 30 years of tick-level and OHLC data, while international markets typically feature over 25 years of coverage. Fundamental analysis is supported with over three decades of standardized financial statements, including balance sheets, income statements, and cash flow data for 65,000 global companies. The platform also includes alternative datasets such as:
- 15+ years of earnings call transcripts (with audio)
- 25+ years of analyst estimates
- 30 years of dividend histories
- 20+ years of EPS surprises
As Finnhub puts it:
"Financial models don't only need vast data; they also need deep past data to test historic scenarios. Why settle with 5 years of historical data or 1 market when you can have it all?"
Real-Time Data Availability
Finnhub excels in real-time data delivery through RESTful APIs and Websockets. It supports U.S. stocks, over 10 forex brokers, and 15+ cryptocurrency exchanges via a single API [62, 66]. For U.S. stocks and cryptocurrencies, real-time streaming is available, while some forex brokers rely on polling endpoints instead of streaming. LSE data comes with a 15-minute delay, and most other international markets provide end-of-day data. The platform’s global infrastructure handles high-capacity analytics, with a rate limit of 30 API calls per second.
Asset Coverage
The platform’s asset coverage is extensive, including:
- Stocks, forex, and cryptocurrencies
- U.S. Government bonds and FINRA Trace corporate bonds
- ETFs, mutual funds, and indices
Users also gain access to data on 65,000 global companies across markets like TSX, LSE, and Euronext. Additionally, Finnhub offers institutional-grade alternative data, such as social sentiment, ESG metrics, congressional trading records, and USPTO patents.
API Language Support
Finnhub makes integration straightforward with official libraries for popular programming languages like Python, Go, JavaScript, Ruby, Kotlin, and PHP. Its RESTful API uses resource-oriented URLs, JSON-encoded responses, and standard HTTP response codes for seamless interaction. Authentication is simple, requiring only an API key via URL parameters or HTTP headers. A downloadable Swagger schema further streamlines automated client generation and integration.
Pricing Tiers and Affordability
Finnhub offers flexible pricing to meet various needs:
- Free Tier ($0/month): Includes U.S. market data, 60 API calls per minute, one year of historical news, and four quarters of EPS surprises.
- All-In-One Plan ($3,000/month, billed annually): Provides global coverage, 30+ years of OHLC and tick data, 20 years of news and press releases, and 900 API calls per minute.
- Enterprise Tier: Custom pricing for large-scale analytics, SLA-backed 99.99% uptime, and access to full-text press releases.
Finnhub’s combination of reliability, deep historical data, and real-time capabilities makes it a powerful tool for algorithmic trading and financial analysis.
10. For Traders
For Traders takes a different approach to algorithmic trading by combining simulated trading challenges with in-depth educational tools. Their demo accounts mimic real market conditions, giving traders a chance to fine-tune and optimize their trading algorithms. These virtual accounts range from $6,000 to $100,000 in virtual capital, making it possible to test strategies in a realistic environment. The platform also integrates live market data, ensuring accurate testing and effective risk management.
Real-Time Data Integration
For Traders works with platforms like DXTrade, TradeLocker, and cTrader to deliver live price feeds directly into its simulated environment. An AI-powered risk management system keeps an eye on trades, ensuring that all algorithmic strategies stick to the set parameters and general rules.
Flexible Pricing Options
The platform offers a tiered pricing model to cater to various budgets. Plans start at $46 for the $6K virtual capital option and go up to $413 for the $100K option. Each tier includes a 12+ video course, unlimited time to achieve a 9% profit target, and bi-weekly payouts with a 15% profit share. A maximum drawdown limit of 5% applies across all plans. These features make it easier for traders to test and refine their algorithms with confidence before moving to live trading.
Data Source Comparison
Here's a quick breakdown of the key data providers, highlighting their strengths for backtesting and live trading. The right choice depends on your strategy's priorities and budget. If you're focused on backtesting, deep historical data is a must. For intraday or high-frequency trading, real-time data with low latency is critical.
Polygon.io stands out for its ultra-low latency real-time feeds, making it ideal for live trading. Meanwhile, Tiingo offers deep end-of-day historical data for just $10 per month, which is perfect for budget-friendly backtesting. As mentioned earlier, Tiingo's affordability and extensive historical archives make it a strong choice for researchers. For global coverage, Alpha Vantage and EOD Historical Data shine, offering access to over 200,000 and 170,000 tickers, respectively, across global markets.
| Data Source | Historical Depth | Real-Time | Asset Coverage | API Languages | Pricing | Best For |
|---|---|---|---|---|---|---|
| Quandl | 20+ years | Limited | Equities, Futures, Alt Data | REST (all languages) | Varies by dataset | Alternative data research |
| Alpha Vantage | 20+ years | Moderate latency | Stocks, Options, FX, Crypto | 20+ community libraries | Free; $29/month+ | Beginners & AI integration |
| Yahoo Finance | 10+ years | 15–20 min delay | Stocks, ETFs, Indices, FX | Unofficial (e.g., yfinance) | Free | Prototyping |
| Polygon.io | Very deep tick data | Ultra-low latency | US Stocks, Options, FX, Crypto | REST, WebSocket | $29–$79+/month | High-frequency trading |
| Intrinio | Deep fundamentals | Moderate | Equities, Options, ESG | Python, R, Ruby, JS, C#, Java | Premium pricing | Fundamental analysis |
| Tiingo | Very deep EOD | Moderate/Limited | Multi-asset | REST API | $10–$30/month | Backtesting on a budget |
| EOD Historical Data | 30+ years | Live available | 170,000+ global tickers | API, Excel, Google Sheets | $17.99–$79.99/month | Affordable global research |
| Interactive Brokers | Deep | High API latency | Stocks, Options, Futures, FX, Bonds | Python, Java, C++, C# | $5–$10/month | Direct execution |
| Finnhub | Deep | Low latency | Stocks, Sentiment, Insider Trades | REST, WebSocket | Free tier; $49+/month | Sentiment-driven strategies |
| For Traders | Live market data | Real-time in simulation | Demo accounts ($6K–$100K) | DXTrade, TradeLocker, cTrader | $46–$413 (one-time) | Simulated algorithm testing |
Each provider caters to different needs. For example, Interactive Brokers and EOD Historical Data offer extensive coverage of equities, bonds, forex, and futures, while specialized platforms like Finnhub focus on sentiment analysis and insider trading data.
"Tiingo is just great... Easily the best value for money. $10 a month gets you access to most asset classes." - Quant Arb, Author, The Quant Stack
Latency is a key differentiator when choosing between live trading and research tools. Polygon.io delivers the low-latency performance required for precise execution, while Yahoo Finance's delay makes it better suited for prototyping. On the other hand, For Traders provides live market data integration, bridging historical backtesting with real-time simulation.
Conclusion
Selecting the right data source depends heavily on your trading strategy. For high-frequency traders, ultra-low latency feeds are essential to minimize slippage, while long-term quantitative researchers benefit more from extensive historical data, which supports thorough backtesting. The quality of your data is what ultimately determines how well your trading strategy reflects real market conditions.
Key factors like accuracy, latency, and historical depth form the backbone of a successful trading approach. Clean data is critical - without it, even the most advanced models risk falling victim to the "garbage in, garbage out" problem. Execution-focused strategies demand low-latency feeds, whereas reliable backtesting hinges on decades of historical data with adjusted prices. Beyond these essentials, practical concerns also play a role. API compatibility with your preferred programming languages and proper management of corporate actions, such as stock splits, can make or break your workflow.
Cost is another crucial consideration. Free platforms like Yahoo Finance might be sufficient for early-stage prototyping, but professional-grade tools such as Bloomberg (priced around $24,000 annually) deliver comprehensive features tailored for live trading. For those with tighter budgets, mid-range services offer competitive monthly plans that strike a balance between cost and functionality. Wherever possible, cross-checking your data with a secondary source and maintaining versioned datasets can help ensure your backtests remain accurate and reproducible.
FAQs
What should I look for in a data source when building a trading algorithm?
When choosing a data source for your trading algorithm, it's crucial to weigh several factors to ensure it aligns with your goals. Start with market coverage - verify that the source offers data for the specific markets and instruments you intend to trade, whether that's stocks, forex, or commodities. Without this, your strategy may lack the necessary foundation.
Next, focus on accuracy and reliability. Low-quality or inconsistent data can lead to poor decisions and expensive errors. For real-time trading, pay attention to the speed and latency of the data delivery. Even minor delays can disrupt your algorithm's performance, especially in fast-moving markets.
Budget considerations also matter. Evaluate the cost of the data source to ensure it fits within your financial plan while still delivering the quality and scope you need. Lastly, consider the ease of integration with your existing tools. The availability of both historical and real-time data is vital, as these are essential for backtesting strategies and executing live trades effectively.
What is the impact of real-time data latency on high-frequency trading strategies?
Real-time data latency is a key factor in high-frequency trading (HFT) strategies. Even the smallest delay in receiving market data can disrupt the speed and accuracy of trade execution. This can mean missed opportunities or trades executed at less-than-ideal prices.
By reducing latency, traders can react to market changes more quickly, increasing their chances of executing trades at the best possible prices. In HFT, where milliseconds can make or break profitability, minimizing latency is absolutely critical to staying competitive and achieving success.
Why should I choose a paid data source instead of free options like Yahoo Finance?
Paid data sources offer highly precise, dependable, and comprehensive datasets, which are crucial for professional trading and building effective algorithms. These services often come with added benefits like manual quality checks, regular updates, and detailed documentation that explains how the data is gathered and processed.
On the other hand, free sources - such as Yahoo Finance - can have drawbacks like missing data, occasional inaccuracies, or slower updates. For advanced tasks like backtesting or refining trading strategies, where accuracy and reliability are non-negotiable, paid data sources become an invaluable resource.
Related Blog Posts
Start Trading with For Traders
Join our platform to test your trading skills, trade virtual capital, and earn real profits. Access educational resources, advanced tools, and a supportive community to enhance your trading journey.
Start your Trading Challenge