

Trading with firm capital means strict rules and no room for guesswork. The right tools can help you stay disciplined, manage risk, and make better decisions. Here's a quick look at the 10 indicators that funded traders rely on the most:
- Moving Averages (MA): Spot trends and dynamic support/resistance zones.
- Relative Strength Index (RSI): Identify overbought/oversold conditions and momentum shifts.
- Moving Average Convergence Divergence (MACD): Track trend direction and momentum.
- Bollinger Bands: Visualize volatility and identify breakout or mean-reversion opportunities.
- Fibonacci Retracement: Pinpoint key levels for support, resistance, and reversals.
- Volume: Confirm price moves and identify institutional activity.
- Volume Weighted Average Price (VWAP): Benchmark price levels for intraday trends.
- Stochastic Oscillator: Highlight momentum shifts in range-bound markets.
- Average True Range (ATR): Measure volatility and set stop-loss levels.
- Support and Resistance Levels: Define entry, exit, and stop-loss points.
Each tool serves a specific purpose, from spotting trends to managing risk. Combining a few of these indicators can help you pass evaluations and maintain funded accounts. Let’s break down how they work and how to use them effectively.
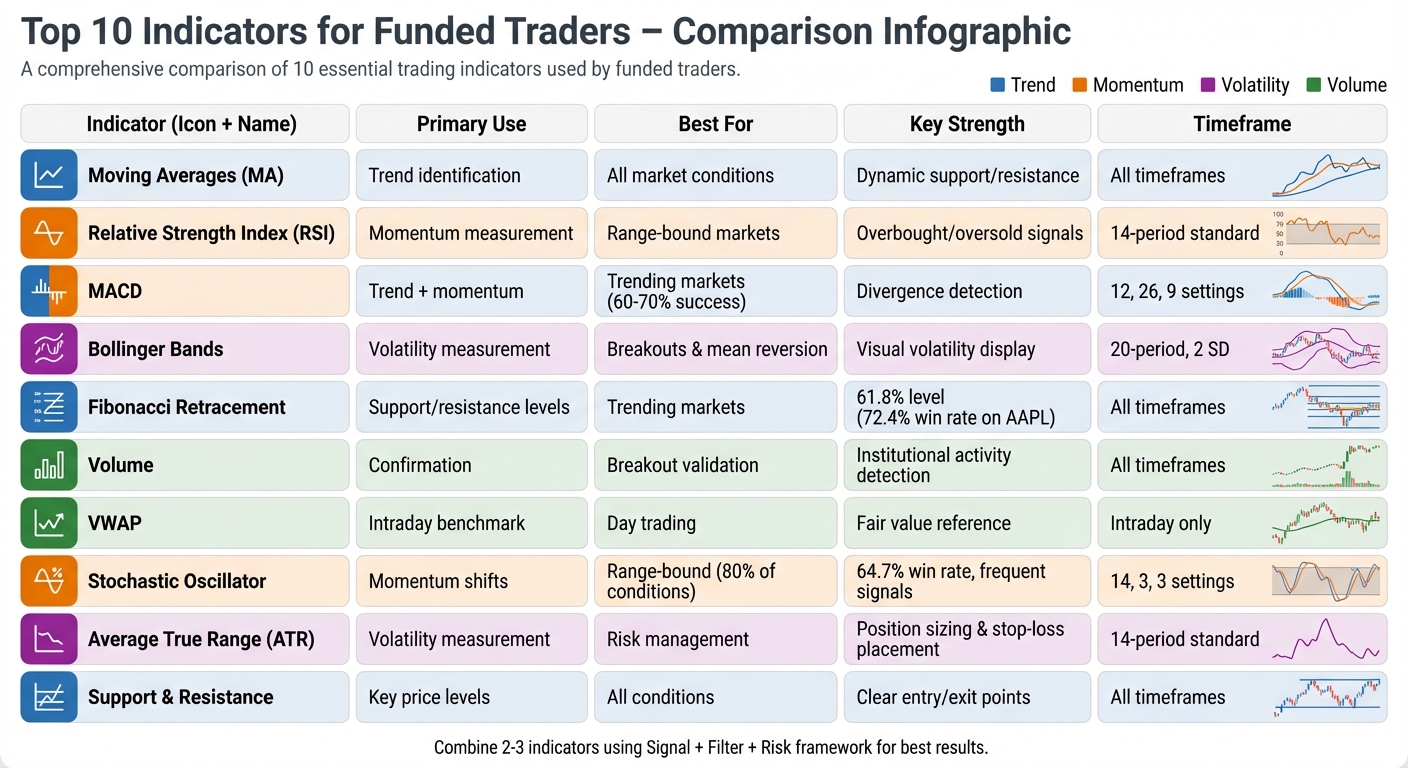
Top 10 Trading Indicators Comparison Chart for Funded Traders
1. Moving Averages (MA)
Effectiveness in Identifying Trends or Market Conditions
Moving averages help smooth out price fluctuations, making it easier to spot trends by filtering out smaller, less meaningful price movements. Among the two main types, the Exponential Moving Average (EMA) is a favorite for many traders because it places more emphasis on recent prices, making it quicker to react to sudden market changes compared to the Simple Moving Average (SMA).
When the price moves above a moving average, it often signals bullish momentum; when it drops below, bearish sentiment might dominate. Crossover strategies, such as a short-term EMA crossing above a long-term EMA (e.g., the 50-period crossing the 200-period), are widely used to identify potential trend reversals and provide clear entry or exit signals. Moving averages also act as dynamic support and resistance levels, often serving as key zones where prices may bounce during pullbacks before resuming the trend.
Practical Application in Prop Trading Evaluations
In intraday trading, especially during prop firm evaluations, moving averages are commonly applied on lower timeframes like 5-minute or 15-minute charts. This helps traders manage high volatility while staying aligned with broader trends. For instance, the 21 EMA is often used as a reference point or "home base" for recognizing intraday trends, making it easier to navigate volatile conditions. Traders dealing with highly volatile assets like cryptocurrencies often rely on EMAs for short-term analysis, while SMAs are more suited for long-term strategies in markets like forex or stocks.
Many traders also pair moving averages with momentum indicators like the Relative Strength Index (RSI) or Moving Average Convergence Divergence (MACD) to strengthen their signals. While moving averages are lagging indicators (since they reflect past price data), tools like the MACD can add a layer of confirmation. For example, the MACD's zero line can act as a filter - suggesting long trades when it's above zero and short trades when it's below. This combination not only clarifies signals but also supports disciplined risk management.
Compatibility with Risk Management Strategies
Moving averages are equally useful for managing risk, offering clear reference points for trade execution. For example, the 200-day SMA is often used as a "master filter", with traders favoring long positions when the price is above this level and short positions when it's below. When entering trades near moving averages like the 20-day or 50-day EMA, traders can set tighter stop-loss levels. These points often serve as bounce zones, improving the reward-to-risk ratio.
For a more refined approach, traders may combine moving averages with the Average True Range (ATR) to set volatility-adjusted stop-losses (typically 1 to 1.5× ATR). Additionally, checking higher timeframe moving averages, such as on a 4-hour chart, ensures that lower timeframe entries (like on a 15-minute chart) align with the broader trend. Waiting for pullbacks to the 20- or 50-period moving average often results in better entry points and reduced risk exposure.
| Moving Average Type | Best Use Case | Key Characteristic |
|---|---|---|
| Simple Moving Average (SMA) | Long-term trend analysis | Smoother, reduces noise |
| Exponential Moving Average (EMA) | Short-term and intraday trading | Reacts quickly to price changes |
| 50/200 Day Crossover | Major trend reversals | High-confidence signal for trend shifts |
| 21 EMA | Intraday trend guide | Balances speed and noise reduction |
Ease of Integration into Trading Platforms and Strategies
Moving averages are widely supported by major trading platforms, making them easy to integrate into trading strategies. In the context of prop trading evaluations, where maintaining consistency and adhering to strict drawdown limits are critical, moving averages provide an objective approach to analyzing market direction. This helps traders stay disciplined and reduces emotional decision-making, even in high-pressure situations.
2. Relative Strength Index (RSI)
Effectiveness in Identifying Trends or Market Conditions
The Relative Strength Index (RSI) is a momentum oscillator that measures the speed and change of price movements, ranging from 0 to 100. Introduced by J. Welles Wilder Jr. in 1978, it has become a go-to tool in prop trading for spotting momentum shifts. Typically, RSI values above 70 suggest overbought conditions, while values below 30 indicate oversold conditions. However, these levels aren't always reliable in strong trends. For example, during a robust uptrend, RSI might hover between 40 and 90, while in a strong downtrend, it could stay between 10 and 60. It’s important not to treat 70 and 30 as automatic reversal triggers - many traders fall into this trap.
"Overbought or oversold conditions are not immediate signals to reverse. They are alerts to pay attention. We need confirmation from price action before we make a move." – ThinkCapital
RSI divergence offers additional insight. A bullish divergence occurs when prices make a lower low, but the RSI forms a higher low, signaling weakening downward momentum. On the flip side, bearish divergence happens when prices reach a higher high, but the RSI forms a lower high, hinting that the upward momentum may be losing strength. Recognizing these patterns can help traders avoid entering positions at the peak of a move.
Another useful technique is the Zone Exit strategy, which confirms momentum shifts by waiting for the RSI to move back above 30 or below 70.
These strategies provide a solid framework for using RSI effectively in trading assessments.
Practical Application in Prop Trading Evaluations
The standard 14-period RSI is particularly effective in prop trading environments. For intraday setups, combining RSI with price structures - such as key support levels or a long-term moving average like the 200 EMA - yields better results than relying on the indicator alone. For instance, a bullish divergence coupled with a price bounce off a key support level often signals a strong setup.
RSI Failure Swings provide another reliable signal. A bullish failure swing occurs when the RSI dips below 30, climbs back above it, pulls back without dropping below 30 again, and then exceeds its previous high. This pattern is often more dependable than standard divergence signals.
In trending markets, it’s essential to adapt RSI usage to the overall direction. For example, in an uptrend (with prices above the 200 EMA), RSI often finds support in the 40–50 range, enabling traders to stay aligned with the prevailing momentum instead of waiting for it to drop to 30.
Compatibility with Risk Management Strategies
RSI is particularly useful for identifying when momentum is fading, which is crucial for managing drawdowns. By signaling when a move is running out of steam, RSI helps traders avoid entering positions at market extremes. To refine risk management, many traders pair RSI with the Average True Range (ATR) to set stop-loss levels based on market volatility, often at 1 to 1.5 times the ATR. This approach ensures exit points are dynamic and responsive to changing conditions.
It’s also a good idea to avoid using RSI alongside similar tools like the Stochastic Oscillator or MACD, as overlapping signals can create confusion. Instead, use RSI for momentum confirmation, moving averages for trend direction, and ATR for volatility analysis.
| RSI Signal | Market Condition | Trader Action |
|---|---|---|
| Above 70 | Overbought | Watch for bearish divergence or wait for a zone exit to sell |
| Below 30 | Oversold | Watch for bullish divergence or wait for a zone exit to buy |
| 40–50 (in uptrend) | Bullish Support | Look for a buy signal on a pullback |
| 50–60 (in downtrend) | Bearish Resistance | Look for a sell signal on a rally |
| Divergence | Trend Exhaustion | Use as a high-probability reversal signal |
Ease of Integration into Trading Platforms and Strategies
RSI is a standard feature on virtually all trading platforms, including MetaTrader 4/5 and TradingView. Its simple calculation and clear visual display make it easy to incorporate into both manual and automated trading strategies. This accessibility supports a disciplined, indicator-based trading approach, which is especially important for traders working with funded accounts.
3. Moving Average Convergence Divergence (MACD)
Effectiveness in Identifying Trends or Market Conditions
The MACD relies on 12- and 26-period EMAs to reveal both trend direction and momentum. Its standard settings - 12, 26, and 9 - include the signal line, which is a 9-period EMA of the MACD line. Unlike the RSI, which operates within a fixed range of 0 to 100, the MACD is an unbounded oscillator that fluctuates freely above or below zero.
The zero line acts as the dividing line between bullish and bearish momentum. When the MACD is above zero, it indicates a bullish trend; when below zero, it signals a bearish trend. This makes the MACD an effective tool for aligning trades with the prevailing market direction. The histogram, represented by vertical bars, provides a visual measure of momentum - bars growing taller indicate increasing strength, while shrinking bars suggest weakening momentum.
"The zero line is the MACD's 50-yard line. It's the equilibrium point between bullish and bearish long-term momentum." – BrightFunded
Divergence is a powerful feature of the MACD, offering early signs of trend exhaustion. A bullish divergence happens when the price forms a lower low, but the MACD creates a higher low, signaling that downward pressure is weakening. Conversely, a bearish divergence occurs when the price makes a higher high while the MACD shows a lower high, hinting at fading upward momentum. In trending markets, MACD-based strategies tend to perform well, achieving success rates of around 60–70%. However, in sideways or choppy conditions, this success rate can drop to about 40%.
Practical Application in Prop Trading Evaluations
The MACD is highly effective for generating precise entry and exit signals, making it a key tool for prop trading evaluations. A common approach involves multi-timeframe analysis: using a higher timeframe like a 4-hour chart to determine the dominant trend, then switching to a lower timeframe, such as a 15-minute chart, to pinpoint entry opportunities. This method aligns trades with institutional market flow, building the consistency needed to meet evaluation criteria and pass the challenge.
Signal line crossovers provide clear trading signals. When the MACD line crosses above the signal line, it generates a bullish signal, while a crossover below indicates bearish momentum. These signals are most reliable when they align with the overall trend - long positions are favored when the MACD is above zero, while short positions are preferred when it’s below. For traders seeking faster signals, shorter settings can capture quick momentum shifts but require extra caution in volatile markets. Waiting for one candle to confirm a crossover can help filter out false signals, enhancing decision-making.
Compatibility with Risk Management Strategies
The MACD also serves as a valuable tool for managing risk during evaluations. Shrinking histogram bars during a winning trade can indicate that momentum is fading, signaling traders to tighten stop-losses or secure partial profits. This helps minimize drawdowns and protect capital.
"The histogram is your momentum dashboard. Its shape and movement tell you about the raw power behind a price move." – BrightFunded
To avoid overlapping signals, it’s better to pair the MACD with tools that measure volatility (like ATR) or volume (such as VWAP) instead of other momentum oscillators like the Stochastic. In range-bound or sideways markets, the MACD can produce frequent false signals, known as "whipsaws", which can lead to unnecessary losses from commissions or drawdowns. In such cases, it may be better to wait for a clear trend or switch to indicators designed for range trading.
Ease of Integration into Trading Platforms and Strategies
The MACD is widely available on popular trading platforms like MetaTrader 4/5 and TradingView. Its three components - the MACD line, signal line, and histogram - are visually intuitive, making it easy to incorporate into both manual and automated trading strategies. This accessibility makes it a reliable choice for traders aiming to meet prop firm evaluation standards.
| Trading Style | Fast EMA | Slow EMA | Signal Line | Best For |
|---|---|---|---|---|
| Scalping | 5 | 13 | 4 | Very short-term moves |
| Day Trading | 8 | 17 | 6 | Intraday momentum |
| Swing Trading | 12 | 26 | 9 | Multi-day trends |
| Position Trading | 19 | 39 | 14 | Long-term trends |
4. Bollinger Bands
Effectiveness in Identifying Trends or Market Conditions
Bollinger Bands consist of three components: a middle Simple Moving Average (SMA) and two outer bands calculated using standard deviation. A common setup uses a 20-period SMA with bands set at 2 standard deviations. When the bands widen, it reflects high volatility, while a "squeeze" indicates low volatility. The middle SMA serves as a trend filter - prices consistently above it suggest a bullish trend, while prices below indicate a bearish trend. During strong trends, prices may "walk the band", touching the outer band without reversing immediately .
"Bollinger Bands help traders visualize volatility in real time, making it easier to judge whether markets are calm, expanding, trending, or reversing." – TrendSpider
These bands are also helpful in identifying overbought and oversold conditions. Touching the upper band can signal an overbought market, while contact with the lower band may indicate an oversold market. However, these signals should be treated as reference points rather than exact triggers. The Bollinger %B indicator adds another layer of analysis by showing a price's position relative to the bands: 100 at the upper band, 0 at the lower band, and 50 at the middle SMA.
Practical Application in Prop Trading Evaluations
The squeeze strategy is a favored approach among prop traders. When the bands contract tightly, it signals low volatility and often precedes a breakout. Traders typically wait for a price close outside the bands, coupled with increased volume, to confirm the breakout during prop trading evaluations. For momentum vs mean reversion strategies, a common tactic during low-volume midday periods (e.g., 12:00–2:00 PM ET) is to watch for long candle wicks extending beyond the outer band that close back inside. Entering trades aligned with the overall trend can make these setups more reliable .
Compatibility with Risk Management Strategies
Bollinger Bands allow for dynamic, volatility-based stop-loss placement. For long trades, stops can be set just below the lower band, while for short trades, stops can be placed just above the upper band. This approach adapts to market conditions rather than relying on static stop levels. In breakout scenarios, stops are often positioned near the middle SMA or the opposite band to protect against false signals.
The bands can also help lock in profits. For example, in an uptrend, if the Bollinger %B drops below 75, it may signal a slowdown in momentum - an opportune time to tighten trailing stops and secure gains. Similarly, during strong trends where prices "walk the band", using the middle SMA as a trailing stop can be effective .
Ease of Integration into Trading Platforms and Strategies
Bollinger Bands are readily available on most trading platforms, including MetaTrader 4/5 and TradingView, and they can be tailored to fit different trading styles. For instance, scalpers might use shorter settings (5–10 periods with a 0.5–1.0 deviation), while swing traders may prefer longer settings (50–100 periods with a 2.0–3.0 deviation). Tools like TrendSpider even provide automated scanners to identify setups based on Bollinger Bands . This accessibility makes Bollinger Bands a versatile tool for traders looking to refine their strategies.
| Market Condition | Bollinger Band Appearance | Recommended Risk Action |
|---|---|---|
| Low Volatility | Narrowing (Squeeze) | Reduce position size; wait for breakout confirmation. |
| High Volatility | Widening Bands | Widen stop-losses using ATR to account for larger swings. |
| Strong Trend | "Walking the Band" | Use the middle SMA as a trailing stop; avoid fading the move . |
| Range-Bound | Parallel/Flat Bands | Trade mean-reversion; buy at the lower band and sell at the upper band. |
⚖️ Trading Indicators Tier List: What Works (and What Doesn’t)
This tier list highlights the most effective tools, but you should also master these 5 indicators specifically designed for funded account success.
5. Fibonacci Retracement
Fibonacci retracement builds on earlier discussions about volatility and trend indicators, offering a way to pinpoint key price levels for more precise trade entries.
Effectiveness in Identifying Trends or Market Conditions
Fibonacci retracement identifies critical price levels - 23.6%, 38.2%, 50%, 61.8%, and 78.6% - that act as support during uptrends and resistance during downtrends. These levels help traders predict where prices might pause or reverse during pullbacks. Among these, the 61.8% level, often called the "Golden Ratio", stands out as a frequent area of strong support or resistance. For example, a two-year backtest of AAPL (2023–2024) revealed that trades based on the 61.8% level achieved a 72.4% win rate.
The depth of a retracement provides clues about market momentum. A shallow pullback (like 38.2%) suggests strong momentum, while deeper retracements (like 78.6%) may signal potential reversals, especially in volatile markets. Combining Fibonacci levels with other tools, such as the RSI, can improve accuracy. For instance, using RSI confirmation alongside Fibonacci retracement reportedly reduces false signals by around 35%. This makes Fibonacci retracement a valuable tool for traders, especially in prop trading evaluations.
Practical Application in Prop Trading Evaluations
In prop trading evaluations, Fibonacci retracement is often used to align key levels with major market movements. Prop traders apply these tools to both long-term trends and short-term intraday swings, looking for "confluence zones" where multiple signals align. For example, traders might focus on the "Golden Pocket", the area between the 61.8% and 65% levels, as a high-probability reversal zone. Many wait for a clear bounce or a candle close above this zone before entering a position.
"Retracement levels help traders spot potential trend reversals, resistance areas or support areas." – Market Rebellion
To use Fibonacci retracement effectively, traders first need to identify a clear trend. In an uptrend, this means spotting higher highs and higher lows, while in a downtrend, it involves lower highs and lower lows. For funded traders, combining Fibonacci levels with other confirmation signals, such as candlestick patterns like hammers or engulfing candles, increases the reliability of their trades.
Compatibility with Risk Management Strategies
Fibonacci retracement is a powerful tool for refining both trade entries and stop-loss placement. In evaluated trading environments, traders set stop-loss orders 1–1.5× ATR beyond key Fibonacci levels, such as below the 61.8% or 78.6% levels for long trades. Additionally, Fibonacci extensions (127.2%, 161.8%, 261.8%) provide clear profit targets. This approach not only manages risk but also accommodates normal market fluctuations.
"Using Fibonacci retracement levels to set stop-loss orders can help manage risk more precisely." – R.J. O'Brien & Associates
Some traders also use the Fibonacci sequence (1, 1, 2, 3, 5, 8...) to scale into positions at successive retracement levels. This method lowers the average entry price and can increase profitability if the market reverses. However, when scaling in, it’s essential to ensure that the total position size stays within the risk limits set by the prop firm.
Ease of Integration into Trading Platforms and Strategies
Fibonacci retracement tools are widely available on popular trading platforms like MetaTrader, NinjaTrader, and TradingView. Setting up these levels is straightforward: traders simply mark a clear high and low. However, subjectivity can be a challenge - different traders might choose different swing highs and lows, leading to variations in retracement levels on the same chart. To address this, traders often look for Fibonacci clusters, where levels from multiple price swings or timeframes align, highlighting the most robust support and resistance zones.
6. Volume
Building on the discussion of technical indicators, volume analysis adds another layer to trading strategies by measuring market participation.
Volume reflects the number of shares or contracts traded within a given period, serving as a gauge of market activity and liquidity. While price action reveals movement, volume confirms the strength behind it. High volume indicates active participation and stronger conviction, whereas low volume often points to uncertainty or unsustainable price changes.
Effectiveness in Identifying Trends or Market Conditions
Volume plays a crucial role in sustaining price movements. Without sufficient volume, even dramatic price swings tend to fizzle out. For instance, when a market breaks through a key resistance level on high volume, it often signals institutional involvement, suggesting the move has staying power. On the other hand, a breakout on weak volume is frequently a false signal that may reverse quickly.
Indicators like On-Balance Volume (OBV) and the Money Flow Index (MFI) help traders identify divergences and potential reversals. If prices hit new highs but OBV fails to rise in tandem, it hints at weakening demand and a possible end to the uptrend. The MFI, which operates on a 0–100 scale, flags overbought conditions above 80 and oversold levels below 20. For Forex traders, where centralized volume data isn't available, tick volume - tracking the frequency of price changes - acts as a substitute for actual trading activity.
Practical Application in Prop Trading Evaluations
Prop traders heavily rely on volume analysis to meet the strict risk and drawdown requirements of evaluations. Tools like Volume Profile, which highlights trading activity at specific price levels rather than over time, help identify High-Volume Nodes (HVN). These areas often mark strong support or resistance zones, as they represent institutional trading activity.
Intraday volume typically follows a U-shaped curve, with peaks during the market open (9:30 AM ET) and close (4:00 PM ET), and a lull between 12:00–2:00 PM ET. Savvy traders avoid taking directional trades during this low-volume period unless employing mean-reversion strategies. The Volume Weighted Average Price (VWAP) serves as a key intraday benchmark, used by institutional traders to assess fair value. On trending days, pullbacks to the VWAP line often provide optimal entry points for funded traders.
This approach ties technical insights directly to practical risk management, aiding traders in navigating prop firm evaluations.
Compatibility with Risk Management Strategies
Volume analysis aligns well with risk management by helping traders determine where to place stop-losses and secure profits. For example, placing stop-losses just beyond the Point of Control (POC) - the price level with the highest traded volume - can provide added protection due to the institutional support or resistance at those levels. When volume remains high but price movement stalls, it often signals a climax where the opposing side absorbs demand or supply, making it an ideal moment to scale out of positions.
Pairing volume with the Average True Range (ATR) allows traders to adjust position sizes to fit current market conditions. In low-liquidity situations, using wider stop-losses can help avoid being stopped out by minor fluctuations that don't reflect the market's true direction. Backtests reveal that volume-based strategies like VWAP Reversion can achieve a 61% win rate with a 1.48 profit factor, while OBV Breakouts deliver a 54% win rate. Additionally, combining volume indicators with price action and other tools can improve strategy success rates by roughly 5%.
This makes volume analysis not just a tool for managing risk but a versatile addition to trading platforms.
Ease of Integration into Trading Platforms and Strategies
Volume indicators are readily available on major trading platforms like TradingView and MetaTrader 5, making them accessible to most traders. Volume Profile, for instance, appears as a horizontal histogram showing activity at various price levels. Traders can also automate volume-based strategies using TradingView Pine scripts to set alerts for VWAP crossings or OBV trendline breaks. For best results, volume analysis is most effective on higher timeframes such as H4, as shorter intervals like M5–M15 often contain too much noise, leading to unreliable signals. Advanced tools like Anchored VWAP - resetting calculations based on significant events like earnings or Federal Reserve announcements - offer even more precise insights into price reactions.
7. Volume Weighted Average Price (VWAP)
VWAP calculates the average price of a stock, weighted by the trading volume, using the formula: VWAP = Σ(Price × Volume) ÷ Σ(Volume). When the price is above VWAP, it suggests bullish momentum, while a price below VWAP indicates bearish pressure. This makes VWAP a key tool for understanding market dynamics.
Effectiveness in Identifying Trends or Market Conditions
VWAP functions as a real-time support and resistance level, adjusting as volume accumulates throughout the trading session. In trending markets, prices staying above VWAP confirm bullish momentum, while staying below signals bearish sentiment. Institutional traders often use VWAP as a benchmark for trade execution, further solidifying its role in market analysis. As one trader from Funded Trading put it:
"VWAP isn't 'just an indicator' - it's on every chart because it frames the battle between buyers and sellers in real time."
To enhance its utility, traders often add standard deviation bands (e.g., 1σ, 2σ, 3σ) to identify overbought or oversold conditions. VWAP tends to be most reliable during the first 1–3 hours of trading when volume is at its peak. However, for stocks with daily volumes under 500,000 shares, its signals can be less dependable.
Practical Application in Prop Trading Evaluations
Prop traders aim for consistent profits while maintaining strict risk controls. VWAP supports this by providing clear entry and exit points. For example, in an uptrend, traders might wait for a pullback to the VWAP line and look for bullish reversal patterns like hammer candles for lower-risk entries. When trading breakouts, volume is critical - breakouts without strong volume often fail.
| Strategy Type | Entry Signal | Stop Loss Placement | Target |
|---|---|---|---|
| VWAP Pullback | Price touches/rejects VWAP in a trend | 1× ATR below VWAP or recent swing low | Prior high or 2:1 reward-to-risk ratio |
| VWAP Breakout | Closes above VWAP with high volume | Just below the VWAP line | Next liquidity zone or pivot point |
| Mean Reversion | Rejection at 2σ or 3σ VWAP bands | Just outside the deviation band | Return to VWAP midline |
Traders often avoid VWAP-based strategies during low-volume periods, such as the lunch hour (12:00–2:00 PM ET), and instead focus on high-volume times for more reliable signals. These strategies align well with the risk management principles discussed below.
Compatibility with Risk Management Strategies
VWAP plays a significant role in disciplined risk management, which is essential for prop trading. It provides clear levels for stop-loss placement, helping traders stay within firm risk limits. For instance, setting stops 1 to 1.5 times the Average True Range (ATR) beyond VWAP can prevent being prematurely stopped out by normal market fluctuations. Professional traders typically risk no more than 0.5–1% of their account per trade. Additionally, analyzing the distance from VWAP can highlight overextended price movements, prompting adjustments like reducing position sizes or tightening stops. Comparing trade fill prices to VWAP also helps evaluate execution quality, particularly for evaluation accounts ranging from $25,000 to $250,000.
Ease of Integration into Trading Platforms and Strategies
VWAP is a standard feature on most trading platforms, including TradingView, NinjaTrader, and Thinkorswim. Since it resets at the start of each trading session, it is inherently an intraday tool. For longer-term insights, traders often use Anchored VWAP, attaching it to key events like earnings reports, FOMC meetings, or session opens to gauge institutional activity.
While VWAP is a powerful tool, professional traders rarely use it alone. It is often paired with other indicators like the Average Directional Index (ADX) to confirm trends and filter false breakouts. VWAP works best with liquid stocks and futures, such as the E-mini S&P 500 and E-mini Nasdaq. However, its reliability declines in decentralized markets like Forex, where comprehensive volume data is unavailable.
8. Stochastic Oscillator
The Stochastic Oscillator measures how a security's closing price compares to its price range over a set period, typically 14 periods. Created by George Lane in the late 1950s, it operates on a scale from 0 to 100. Values above 80 suggest that prices are near the higher end of their recent range (potentially overbought), while readings below 20 indicate prices are near the lower end (potentially oversold). The tool consists of two lines: the fast-moving %K line and the slower %D line, which averages %K over three periods to smooth fluctuations. As George Lane explained:
"Stochastics measures the momentum of price. If you visualize a rocket going up in the air – before it can turn down, it must slow down. Momentum always changes direction before price."
This momentum-based tool is especially helpful for identifying shifts in market trends.
Effectiveness in Identifying Trends or Market Conditions
The Stochastic Oscillator shines in sideways or range-bound markets, which make up about 80% of trading conditions. A key signal occurs when the %K line crosses the %D line: a bullish signal happens when %K crosses above %D in oversold territory (below 20), and a bearish signal emerges when %K crosses below %D in overbought territory (above 80). It can also reveal divergences, where price reaches a new high or low, but the oscillator fails to follow suit - often signaling a potential loss of momentum.
That said, in strongly trending markets, the oscillator can stay in extreme zones (above 80 or below 20) for extended periods. To address this, traders often combine it with trend-confirming tools like Moving Averages or the Average Directional Index (ADX) to better assess market conditions.
Practical Application in Prop Trading Evaluations
For traders working within strict drawdown limits, the Stochastic Oscillator offers a reliable way to refine entry and exit points. For instance, a SPY backtest using a 14, 3, 3 setup with overbought and oversold filters produced a 64.7% win rate, a 1.73 profit factor, and a -12.8% drawdown.
Day traders and scalpers particularly value this tool for its frequent signals. On a 5-minute chart, it can generate 8 to 12 signals daily, compared to only 3 to 5 signals from the RSI. However, this sensitivity comes with a downside: more false signals. Currency strategist Kathy Lien noted:
"Stochastics is highly sensitive, generating frequent signals... Great for hitting daily profit targets quickly but prone to false alarms that may erode profits."
To filter out noise, traders often focus on crossover signals that occur exclusively in overbought or oversold zones. They also align these signals with higher timeframe trends and use tools like the Volume Weighted Average Price (VWAP) as an additional directional guide.
Compatibility with Risk Management Strategies
The Stochastic Oscillator pairs well with disciplined risk management, a key factor in prop trading success. Many traders use the Average True Range (ATR) to set stop losses that adjust for volatility, typically at 1 to 1.5 times the ATR. Position sizing is equally critical, with most traders risking no more than 1–2% of their capital per trade .
For volatile assets like cryptocurrencies or certain forex pairs, shorter oscillator settings (5–9 periods) provide quicker signals, while longer settings (21–28 periods) help smooth out noise in more stable assets like blue-chip stocks. To avoid redundancy, traders generally avoid combining the Stochastic Oscillator with similar momentum tools like Williams %R or StochRSI.
Ease of Integration into Trading Platforms and Strategies
The Stochastic Oscillator is readily available on popular trading platforms such as MetaTrader 4, MetaTrader 5, and TradingView. Its default settings (14, 3, 3) are versatile but can be adjusted to suit specific timeframes or asset volatility. Rather than relying on it as a standalone tool, many traders use it alongside complementary indicators. For instance, the RSI might be used to gauge overall market direction, while the Stochastic Oscillator pinpoints optimal entry points. This layered approach is a hallmark of professional trading strategies, particularly for those navigating the demands of funded trading programs.
9. Average True Range (ATR)
The Average True Range (ATR), introduced by J. Welles Wilder Jr. in 1978, was originally designed for the commodities market but has since become a staple for forex, stocks, and cryptocurrency trading. Unlike many indicators that aim to predict price direction, ATR focuses solely on measuring how much an asset typically moves, serving as a pure gauge of volatility. The most common setting is 14 periods, though short-term traders often prefer 10 or fewer to capture quicker market shifts.
When the ATR line rises, it signals increasing volatility, while a declining line indicates the market is calming or consolidating. This makes ATR a valuable tool for distinguishing meaningful price changes from regular market noise.
Effectiveness in Identifying Trends or Market Conditions
ATR’s strength lies in its ability to measure volatility without predicting price direction - it’s entirely neutral in that regard. Instead, it helps traders separate significant price movements from typical fluctuations. For instance, if the daily ATR of a market is 20 points, setting a profit target of 50 points on an intraday trade might be overly ambitious.
It becomes especially useful during breakouts accompanied by a sudden spike in ATR, which often confirms the move’s significance. Conversely, when ATR is unusually low, it can signal that the market is gearing up for a significant expansion phase. As John Bollinger aptly put it:
"High volatility begets low, and low volatility begets high".
Practical Application in Prop Trading Evaluations
For traders in prop firms, where strict drawdown limits are common, ATR provides a clear and objective framework for decision-making. Many professional traders use a multiplier according to the prop trading glossary of 1–1.5× ATR to determine initial stop-loss levels. For example, a swing trader entering APP at $100 in September 2024 used a 2× ATR stop (ATR ≈7.5) and set the stop at $85. By February 2025, as ATR increased to 30, the trader adjusted the stop, avoiding premature exits and staying in the trade.
Compatibility with Risk Management Strategies
ATR is a key tool for standardizing risk across different assets. To calculate lot sizes, divide the dollar amount you’re willing to risk (typically 0.5–1% of your account) by the ATR-based stop distance. This ensures that more volatile assets result in smaller positions, keeping risk consistent.
Another popular approach is the "Chandelier Exit", a trailing stop technique developed by Chuck LeBeau. This method sets a stop-loss at a multiple of ATR (commonly 3×) below the highest price reached since entering the trade. As LeBeau explained:
"Just as a chandelier hangs down from the ceiling of a room, the chandelier exit hangs down from the high point or the ceiling of our trade".
This strategy helps lock in profits during trends while allowing the trade enough room to breathe.
Ease of Integration into Trading Platforms and Strategies
ATR is widely available on major trading platforms like MetaTrader 4, MetaTrader 5, and TradingView. While the default setting is 14 periods, intraday traders often fine-tune it to 2–10 periods, and longer-term traders may opt for 20–50 periods. As one prop trading resource notes:
"ATR is the risk manager's best friend... it gives you an objective way to size stops and targets".
Unlike fixed percentage-based strategies, ATR adapts to real-time market conditions. It expands during high-volatility phases and contracts during quieter periods, making it a flexible and reliable tool for traders.
10. Support and Resistance Levels
Support and resistance levels are essential tools for managing risk and defining precise trade parameters. These levels represent price zones where buying or selling pressure shifts, causing the market to reverse direction. As market volatility changes, these zones can adjust. When a support level is broken, it often becomes a new resistance, and the reverse is also true. This concept works well alongside other technical indicators, offering traders opportunities for controlled entries during retests.
Effectiveness in Identifying Trends or Market Conditions
Support and resistance levels help distinguish between trending and range-bound markets. For example, when prices repeatedly bounce between two levels without breaking through, the market is likely in a sideways phase, favoring mean-reversion strategies. On the other hand, a strong break of a key level, especially with increased volume, signals a trending market where breakout strategies become more effective.
Traders identify these levels by analyzing recent highs and lows, drawing trend lines, or using tools like Market Profile and VWAP. Psychological round numbers, such as $100.00 or 1.0000, often act as significant barriers since traders frequently cluster orders around these points. When these levels align with other indicators, they form stronger "confluence zones".
Practical Application in Prop Trading Evaluations
Support and resistance levels are invaluable in prop trading evaluations, especially given strict drawdown limits. They provide clear "if-then" scenarios for trade entry and invalidation. Validating these levels with volume expansion or candlestick patterns like hammers or engulfing patterns can enhance their reliability.
One effective tactic is the "test of the breakout" strategy. After a resistance level is breached, waiting for the price to pull back and retest that level as new support can help avoid false breakouts.
Professional traders often use tools like Volume Profile to pinpoint high-volume areas where institutional activity is concentrated. These zones are generally more reliable than arbitrary price points. Additionally, the Point of Control (POC) from Market Profile often acts as a magnet, attracting price back to these levels and providing natural targets for profit-taking or scaling positions.
Compatibility with Risk Management Strategies
Support and resistance levels simplify stop-loss placement. For long trades, stops are typically set just below support; for short trades, just above resistance. To account for normal market fluctuations, stops are often placed 1–1.5× ATR beyond these levels.
Position sizing can also be calculated using these levels. Divide a fixed dollar risk amount (1–2% of the account balance) by the distance to the ATR-based stop. This ensures that more volatile assets result in smaller positions, keeping risk consistent across trades. It's also wise to confirm support and resistance levels on higher timeframes - such as daily or weekly charts - before executing intraday strategies, to avoid trading against major structural barriers.
Market behavior around these levels can vary by session. Mid-day, low-volume periods tend to respect support and resistance more, while high-volume opening and closing periods often lead to breaks due to institutional flows.
Ease of Integration into Trading Platforms and Strategies
Platforms like MetaTrader, TradingView, and ATAS make it easy to draw support and resistance levels while incorporating essential technical analysis tools like 50-period and 200-period moving averages.
VWAP is another useful tool, acting as an intraday fair value line. On trending days, pullbacks to VWAP provide low-risk entries in the trend's direction. On range-bound days, VWAP often serves as a mean-reversion target. The ADX indicator can further refine strategies - values above 25 indicate a strong trend suitable for breakouts, while values below 20 suggest range-bound conditions ideal for mean-reversion.
High-probability setups often occur at confluence zones, where multiple indicators align. For instance, a Fibonacci retracement overlapping with a 200-period EMA at a psychological round number creates a key level worth monitoring. As ATAS notes:
"Support and resistance level is not just a basic trading concept - it is a powerful tool used by professionals".
Conclusion
The ten indicators discussed act as decision-making tools that help reduce uncertainty and bring consistency to your trading approach. For funded traders working within strict drawdown limits and profit targets, these indicators turn subjective decisions into objective signals. They protect your capital while helping you identify setups with higher potential. When paired with a disciplined trading strategy, this framework can significantly enhance your performance.
To pass a funded account challenge, it's crucial to use these indicators strategically. Instead of cluttering your charts with multiple tools, stick to the "Signal + Filter + Risk" framework. For example, you might use VWAP to pinpoint entry points, MACD to confirm trend strength, and ATR to manage volatility and position sizing. This approach avoids overcomplication and keeps your trading decisions clear and consistent.
It's important to remember that indicators behave differently based on market conditions and the time of day. Tailor your settings to align with your trading style and timeframe. For instance, moving averages are effective in trending markets but struggle in sideways conditions, while RSI performs better in range-bound markets, even though it can stay overbought or oversold during strong trends. Adjust your strategy to fit market sessions - momentum tools are most effective at market open, while mean-reversion tools perform better during quieter periods.
Before applying these tools in live markets, test them on demo accounts. A scalper using a 5-minute chart will need different settings than a swing trader analyzing daily candles. Use this time to build experience and refine your approach, ensuring it aligns with your style and the realities of live trading.
As BrightFunded emphasizes:
"In the world of prop trading, you live and die by your consistency, your ability to manage drawdown, and your skill in identifying high-probability setups".
These ten indicators provide a clear framework to cut through market noise, offering actionable insights that can help you pass evaluations and maintain funded accounts over time.
FAQs
How can moving averages help funded traders manage risk effectively?
Moving averages are a handy tool for traders looking to manage risk and stay aligned with the market's overall trend. By smoothing out the noise of short-term price swings, they offer a clearer view of whether the market is heading up or down. This clarity helps traders make better decisions about when to enter or exit trades.
One popular strategy involves moving average crossovers. For example, traders might watch for a shorter-term moving average, like a 50-period average, crossing above or below a longer-term one, such as a 200-period average. These crossovers can signal potential trend shifts or confirm existing ones. This method helps traders avoid knee-jerk decisions and limits the chances of falling for false signals, especially in choppy markets. By syncing trades with the market's momentum, moving averages become a dependable tool for reducing risk and staying on track with the trend.
How does the Relative Strength Index (RSI) help identify momentum changes in trading?
The Relative Strength Index (RSI) is a popular momentum indicator designed to help traders detect potential changes in price trends. It evaluates the speed and extent of recent price movements to determine if an asset is overbought or oversold, which can hint at possible reversals or shifts in the trend.
Many traders rely on RSI to fine-tune their entry and exit points. Typically, RSI values above 70 suggest an asset might be overbought, while values below 30 indicate it could be oversold. This tool is particularly useful in prop trading, where accuracy and consistency are crucial for managing funded accounts effectively.
Why is analyzing trading volume important for confirming price trends?
Analyzing trading volume plays a key role in confirming price trends. Why? Because it reveals whether a price movement has strong market participation behind it. When you see higher trading volume accompanying a price increase or decrease, it often suggests the trend has more staying power. On the flip side, low volume might indicate that the move lacks conviction.
For traders, understanding volume can be a game-changer. It helps to gauge the strength of market trends, enabling more informed decision-making - a skill that's especially critical for maintaining consistent performance in prop trading environments.
Related Blog Posts
Start Trading with For Traders
Join our platform to test your trading skills, trade virtual capital, and earn real profits. Access educational resources, advanced tools, and a supportive community to enhance your trading journey.
Start your Trading Challenge